| Assignments | Points |
|---|---|
| Homeworks | 130 |
| Supplementals | 70 |
| Final Project | 200 |
| Total | 400 |
Assignments
As outlined in the Syllabus, most class meetings will include a homework assignment. Supplemental Learning platforms (Codecademy) will also be used as additional homework assignments, and the course will conclude with a final project. More detail about each is provided below.
Homework Assignments
Each homework assignment is worth 10 points, and require your “best honest effort”, which includes contacting me if you need help. Please do not turn in partial work. Instead, please ask for help! For the homework assignments, if you are stuck for more than 10-15 minutes, reach out for help. Don’t spend any more than 15 minutes before reaching out. You can ask your classmates, the internet, or me!
| Date Assigned | Date Due | Assigned | Key | Points |
|---|---|---|---|---|
| Oct-08 | Oct-15 | Homework 1 | Key HW 1 | 13 |
| Oct-15 | Oct-22 | Homework 2 | Key HW 2 | 13 |
| Oct-15 | Oct-22 | Homework 3 | Key HW 3 | 13 |
| Oct-22 | Oct-29 | Homework 4 | Key HW 4 | 13 |
| Oct-29 | Nov-05 | Homework 5 | Key HW 5 | 13 |
| Oct-29 | Nov-05 | Homework 6 | Key HW 6 | 13 |
| Nov-05 | Nov-12 | Homework 7 | Key HW 7 | 13 |
| Nov-12 | Nov-19 | Homework 8 | Key HW 8 | 13 |
| Nov-19 | Nov-26 | Homework 9 | Key HW 9 | 13 |
| Nov-26 | Dec-03 | Homework 10 | Key HW 10 | 13 |
Supplemental Learning Assignments
| Date Assigned | Date Due | Assigned | Screenshot | Points |
|---|---|---|---|---|
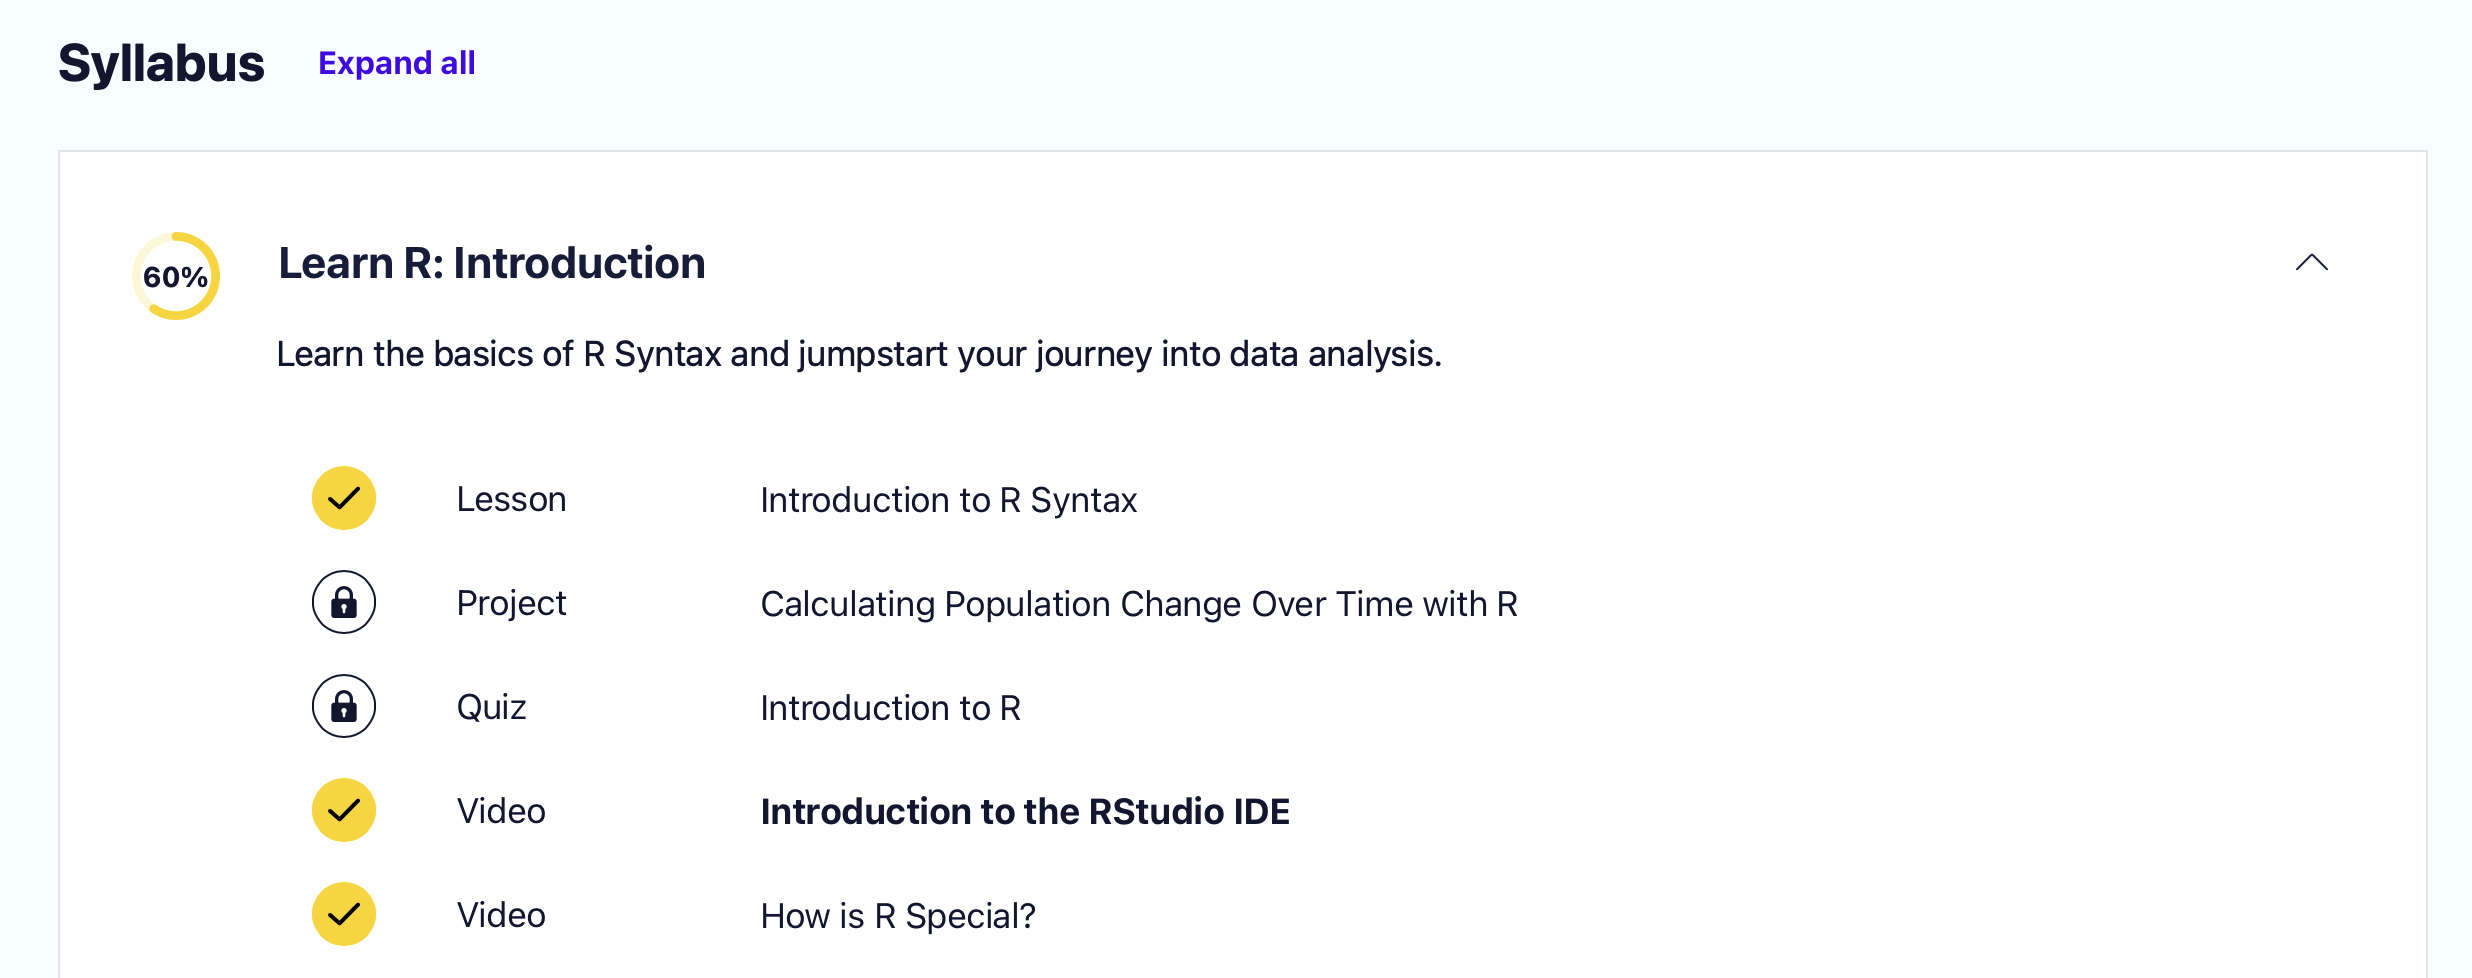
| Oct-01 | Oct-08 | Codecademy: Introduction to R Syntax | (example) | 10 |
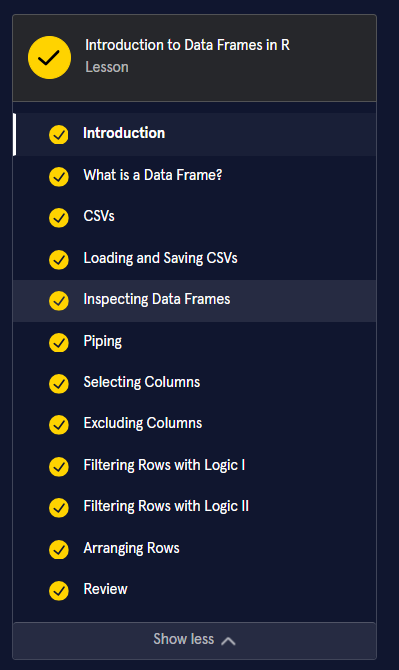
| Oct-08 | Oct-15 | Codecademy: Introduction to Data Frames in R | (example) | 10 |
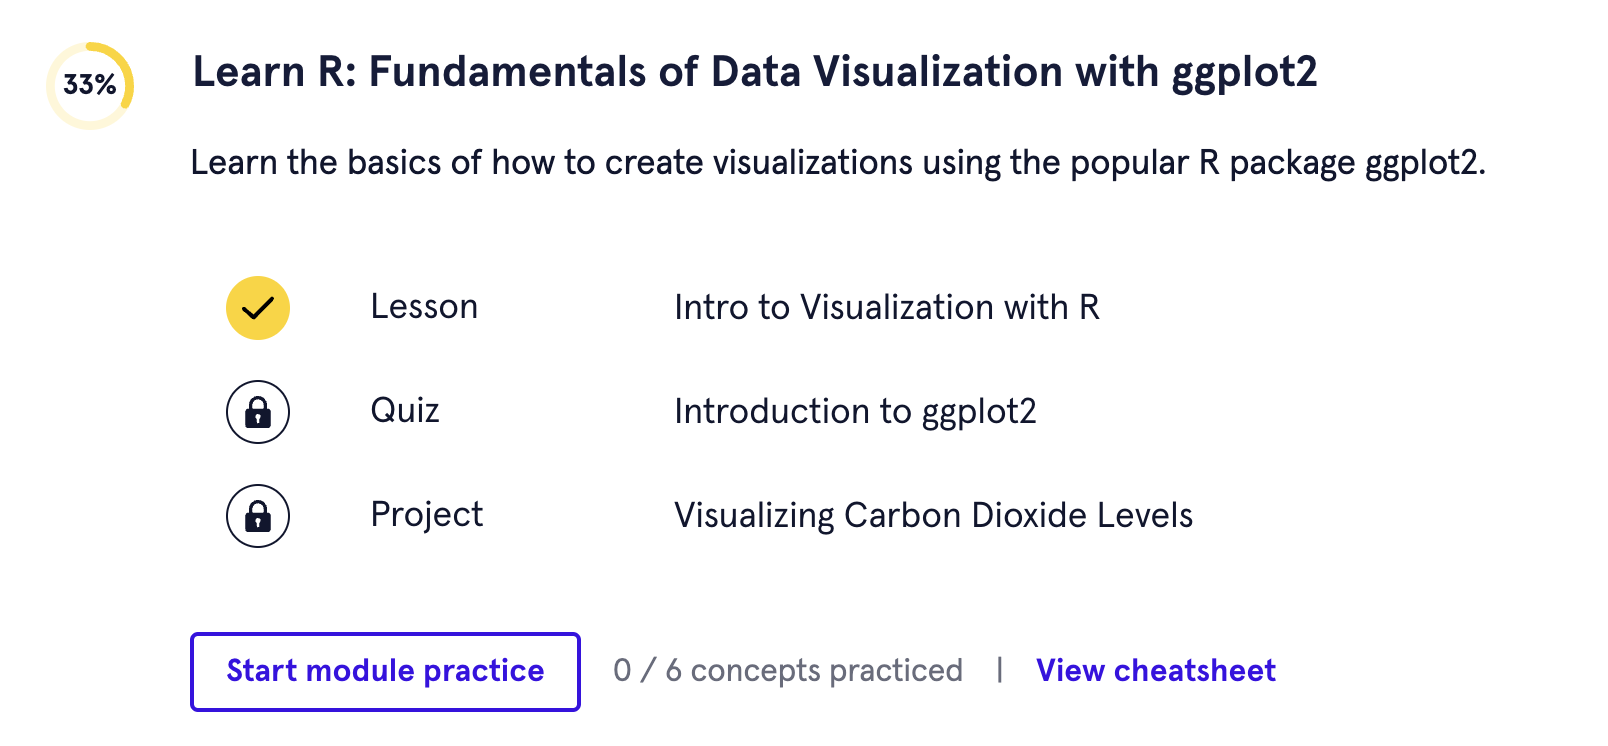
| Oct-08 | Oct-15 | Codecademy: Introduction to Visualization with R | (example) | 10 |
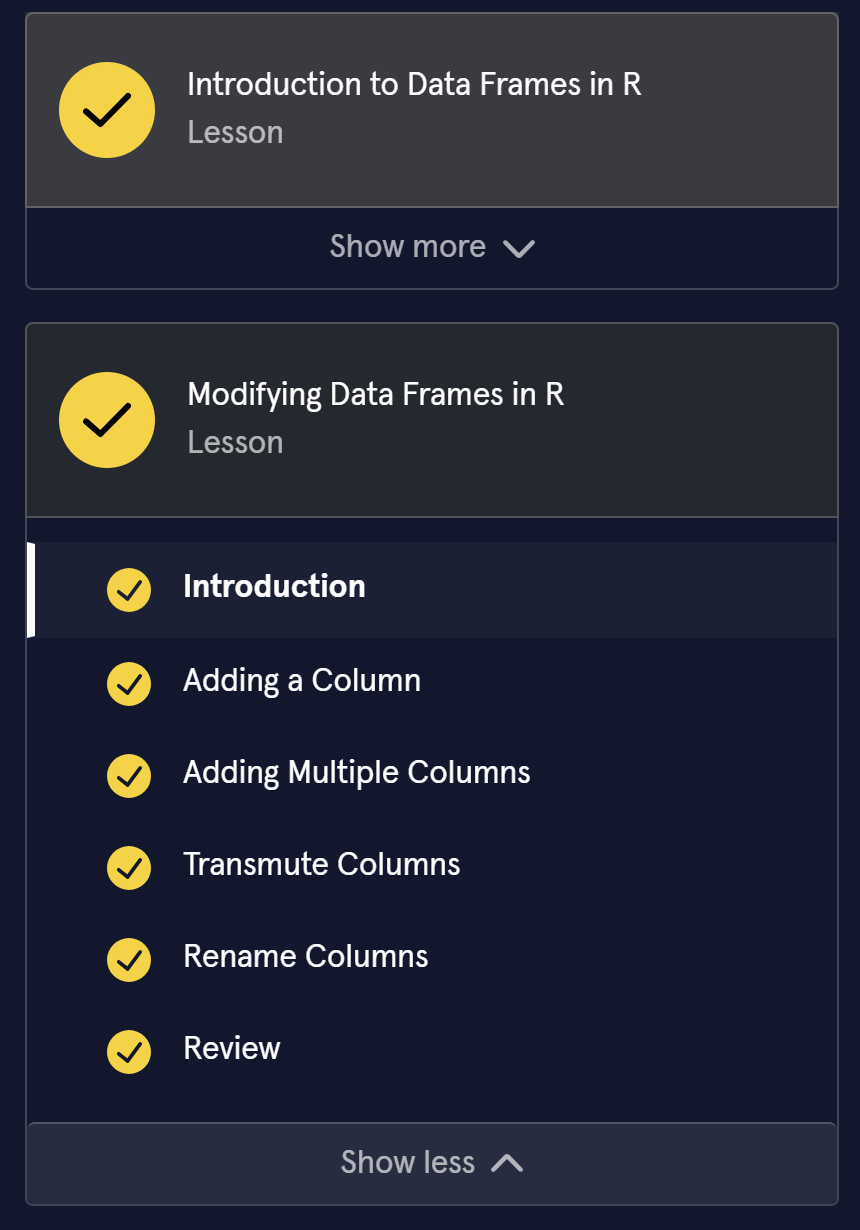
| Oct-15 | Oct-22 | Codecademy: Modifying Data Frames | (example) | 10 |
| Oct-15 | Oct-22 | Codecademy: Aggregates in R | (example) | 10 |
| Nov-05 | Nov-12 | Codecademy: Joining Tables in R | (example) | 10 |
| Nov-12 | Nov-19 | Codecademy: Data Cleaning in R | (example) | 10 |
Final Project
| Date Assigned | Date Due | Assigned | Points |
|---|---|---|---|
| Oct-01 | Oct-29 | Outline | 15 |
| Oct-01 | Nov-26 | Draft Data Prep Script | 25 |
| Oct-01 | Dec-03 | Peer Review of Script | 25 |
| Oct-01 | Dec-03 | Presentation | 25 |
| Oct-01 | Dec-10 | Paper | 110 |
Final Project
The final project in this class is a group project, requiring students use a “real world” dataset to write, essentially, a miniature manuscript, including an introduction (paragraph or two), methods, results, and discussion (again, maybe 2-3 paragraphs). Ideally, students would work with a dataset that includes variables they are interested in using beyond just this class; however, if students do not have access to a dataset, the instructor will provide one. Students who do not have access to data should plan to meet with the instructor as soon as possible so a dataset can be provided. Additionally, the dataset must be able to be shared publicly, as the full project will be required to be housed on GitHub and be fully reproducible. If making your data publicly available is a problem for you, please contact the instructor as soon as possible. We can work together to either find a dataset that will work for you, or simulate a dataset that is similar to the data you’d like to work with in reality (and then all your code should work for the real dataset, but you can share the simulated data with your classmates). Students are required to work in groups of 2-4 people. The final assignment is assigned during the first class, and groups must be finalized by the end of Week 2 (at which point students who have not self-selected into groups will be randomly assigned).
I will investigate the commits made by different authors when evaluating the final project. If it is obvious that one person did not utilize GitHub, and instead added all of their contributions through a single or only a few commits, I will dock points from that individual. There should be numerous commits by each author, and they should be roughly even in terms of contribution activity (which GitHub has metrics to track, both in terms of the number of commits as well as the number of lines modified).
Outline (15 points)
A basic outline of the final project is due at the end of Week 5. The outline should include a description of the data to be used, a discussion of what preparatory work will need to be done, and how the requirements of the final project will be met. The outline is intended to be low-stakes and is primarily designed to be a means for you to obtain feedback on the feasibility of the project and areas to consider.
Draft Data Preparation Script (25 points)
At the end of Week 8, you must have a draft of the data preparation complete, including moving the data from its raw to tidy form and a variety of exploratory data visualizations. Final project must use the following functions: pivot_longer(), select(), filter(), mutate(), pivot_wider(), group_by(), and summarize().
Peer Review of Data Preparation Script (25 points)
Following the submission of the data preparation scripts, you will be assigned to review your peers’ code. The purpose of this exercise is to learn from each other. Programming is an immensely open-ended enterprise and there are lots of winding paths that all ultimately end up at the same destination. During your peer review, you must note (a) at least three areas of strength, (b) at least one thing you learned from reviewing their script, and (c) at least one and no more than three areas for improvement. Making your code publicly available can feel daunting. The purpose of this portion of the final project is to help us all learn from each other, not to denigrate. Under no circumstances will negative comments be tolerated. Any comments that could be perceived as negative, and outside the scope of the code, will result in an immediate score of zero. Be constructive in your feedback. Be kind. We are all learning.
Final Project Presentation (25 points)
Each group will present on their final project during Week 10, which is expected to still be in progress. These presentations are expected to be informal, and emphasize what learning occurred during the project. Specifically, the presentations are to commiserate with each other about the failures and challenges experienced along the way, while also celebrating the successes. Learning R is a difficult task, and we should all take solace knowing that others are struggling along with us. The final presentation should be equal parts “journey” and substantive findings/conclusions/results. Students are expected to present for approximately 10 minutes each (20-40 minutes per group), although the time may change depending on the enrollment of the class.
| Presentation Rubric | |
|---|---|
| Criteria | Points possible |
| Challenges faced along the way | 5 |
| Victories and things to celebrate | 5 |
| Challenges you are still facing | 5 |
| Substantive findings/interpretations | 5 |
| Next R hurdle to tackle | 5 |
| Total | 25 |
Final Paper (110)
The purpose of the final project is to allow students an opportunity to demonstrate all the skills they have learned throughout the course. The final project must (a) be a reproducible and dynamic R Markdown document with references to the extant literature; (b) be housed on GitHub, with contributions from all authors obvious; (c) demonstrate moving data from its raw “messy” format to a tidy data format through the R Markdown file, but not in the final document; (d) include at least two exploratory data visualizations, and (e) include at least summary statistics of the data in tables, although fitted models of any sort are an added bonus (not literally, there are not extra points for fitting a model). The points for the final project are broken down as follows.
| Final Paper Rubric | |
|---|---|
| Criteria | Points Possible |
| Writing | |
| Abstract | 5 |
| Introduction | 5 |
| Methods | 5 |
| Results | 5 |
| Discussion | 5 |
| References | 5 |
| Code | |
| Document is fully reproducible | 25 |
| Demonstrate use of inline code | 5 |
| At least two data visualizations | 10 (5 pts each) |
| Demonstrate tidying messy data using: | |
pivot_longer() |
5 |
mutate() |
5 |
select() and filter() |
5 |
pivot_wider() |
5 |
| At least one table of descriptive statistics | 10 |
group_by() |
5 |
summarize() |
5 |
| Total | 110 |