library(tidyverse)
four_cyl <- filter(mpg, cyl == 4)Week 3: Intro to {purrr}
& Lab 2
{purrr} & Lab 2
Week 3
Agenda
- Review Lab 1
- Thinking more about functional programming
- A small example
- Introduce you to
{purrr}and contrast it with the base functions we learned last week
Learning objectives
- Understand how
purrr::map()relates tolapply()andforloops - Understand the four basic variants of
purrr::map(), when they should be used, and when they will fail - Understand what functional programming is, and how
{purrr}can help facilitate the process
Review Lab 1
Functional Programming
What is Functional Programming?
decomposing a big problem into smaller pieces, then solving each piece with a function or combination of functions
-- Adv-R
Example
Calculate top mpg manufactures
(let’s just subset the data to 4 cylinders for this example)
Example
Now we’ll filter for cases where the city miles per gallon is in the top 10% (i.e., greater than or equal to the \(90^{th}\) percentile)
ninety <- four_cyl |>
    filter(cty >= quantile(cty, probs = 0.9))
ninety
# A tibble: 10 × 11
manufacturer model displ year cyl trans drv cty hwy fl class
<chr> <chr> <dbl> <int> <int> <chr> <chr> <int> <int> <chr> <chr>
1 honda civic 1.6 1999 4 manu… f 28 33 r subc…
2 honda civic 1.6 1999 4 manu… f 25 32 r subc…
3 honda civic 1.8 2008 4 manu… f 26 34 r subc…
4 honda civic 1.8 2008 4 auto… f 25 36 r subc…
5 toyota corolla 1.8 1999 4 manu… f 26 35 r comp…
6 toyota corolla 1.8 2008 4 manu… f 28 37 r comp…
7 toyota corolla 1.8 2008 4 auto… f 26 35 r comp…
8 volkswagen jetta 1.9 1999 4 manu… f 33 44 d comp…
9 volkswagen new beetle 1.9 1999 4 manu… f 35 44 d subc…
10 volkswagen new beetle 1.9 1999 4 auto… f 29 41 d subc…Example
Now let’s count the unique occurrences for each manufacturer, manufacturer/model, and class
(count_mfr <- count(ninety, manufacturer))# A tibble: 3 × 2
manufacturer n
<chr> <int>
1 honda 4
2 toyota 3
3 volkswagen 3(count_model <- count(ninety, manufacturer, model))# A tibble: 4 × 3
manufacturer model n
<chr> <chr> <int>
1 honda civic 4
2 toyota corolla 3
3 volkswagen jetta 1
4 volkswagen new beetle 2(count_class <- count(ninety, class))# A tibble: 2 × 2
class n
<chr> <int>
1 compact 4
2 subcompact 6Example
Produce a plot for each
plot_mfr <- count_mfr |>
ggplot(aes(fct_reorder(manufacturer, -n), n)) +
geom_col(aes(fill = manufacturer)) +
scale_fill_brewer(palette = "Set3") +
labs(title = "Manufacturers",
x = "",
y = "") +
guides(fill = "none")
plot_mfr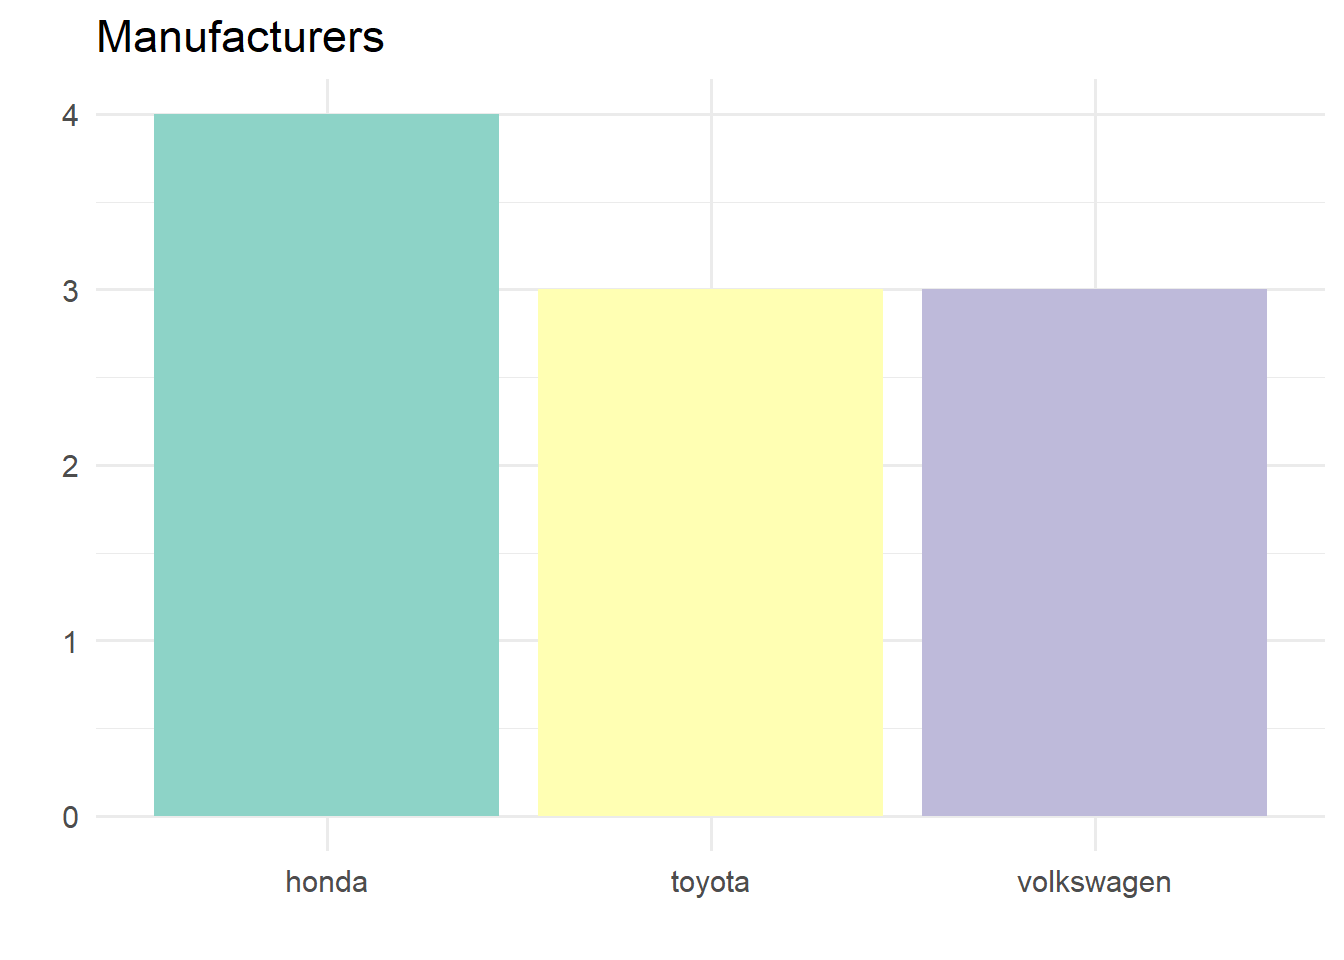
plot_car <- count_model |>
unite(car, manufacturer, model, sep = " ") |>
ggplot(aes(fct_reorder(car, -n), n)) +
geom_col(aes(fill = car)) +
scale_fill_brewer(palette = "Set3") +
labs(title = "Top 10% of city mpg",
subtitle = "Car frequency",
x = "",
y = "") +
guides(fill = "none")
plot_car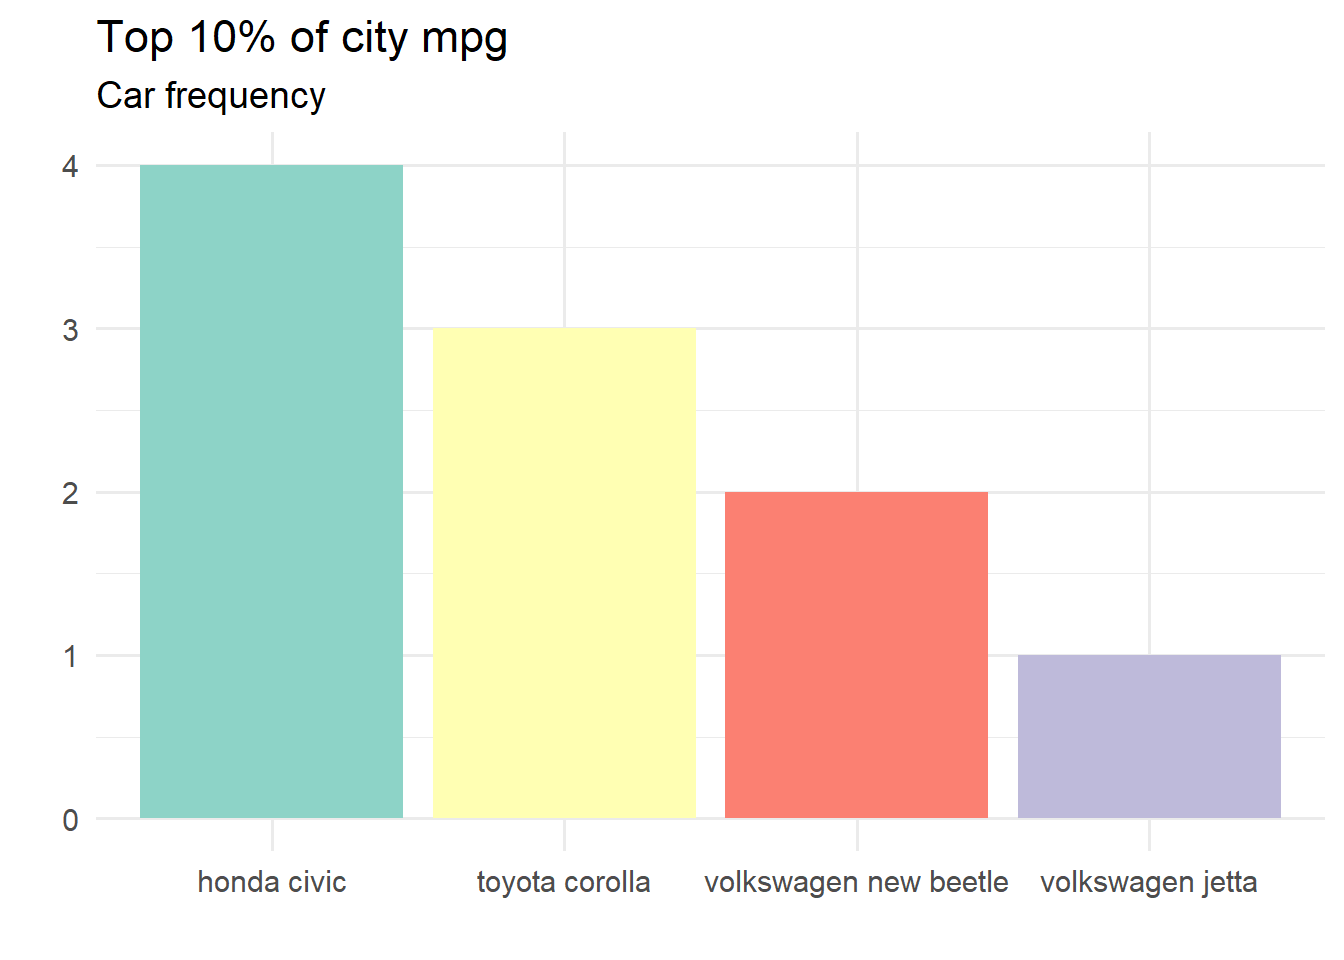
plot_class <- count_class |>
ggplot(aes(fct_reorder(class, -n), n)) +
geom_col(aes(fill = class)) +
scale_fill_brewer(palette = "Set3") +
labs(title = "Car Class",
x = "",
y = "") +
guides(fill = "none")
plot_class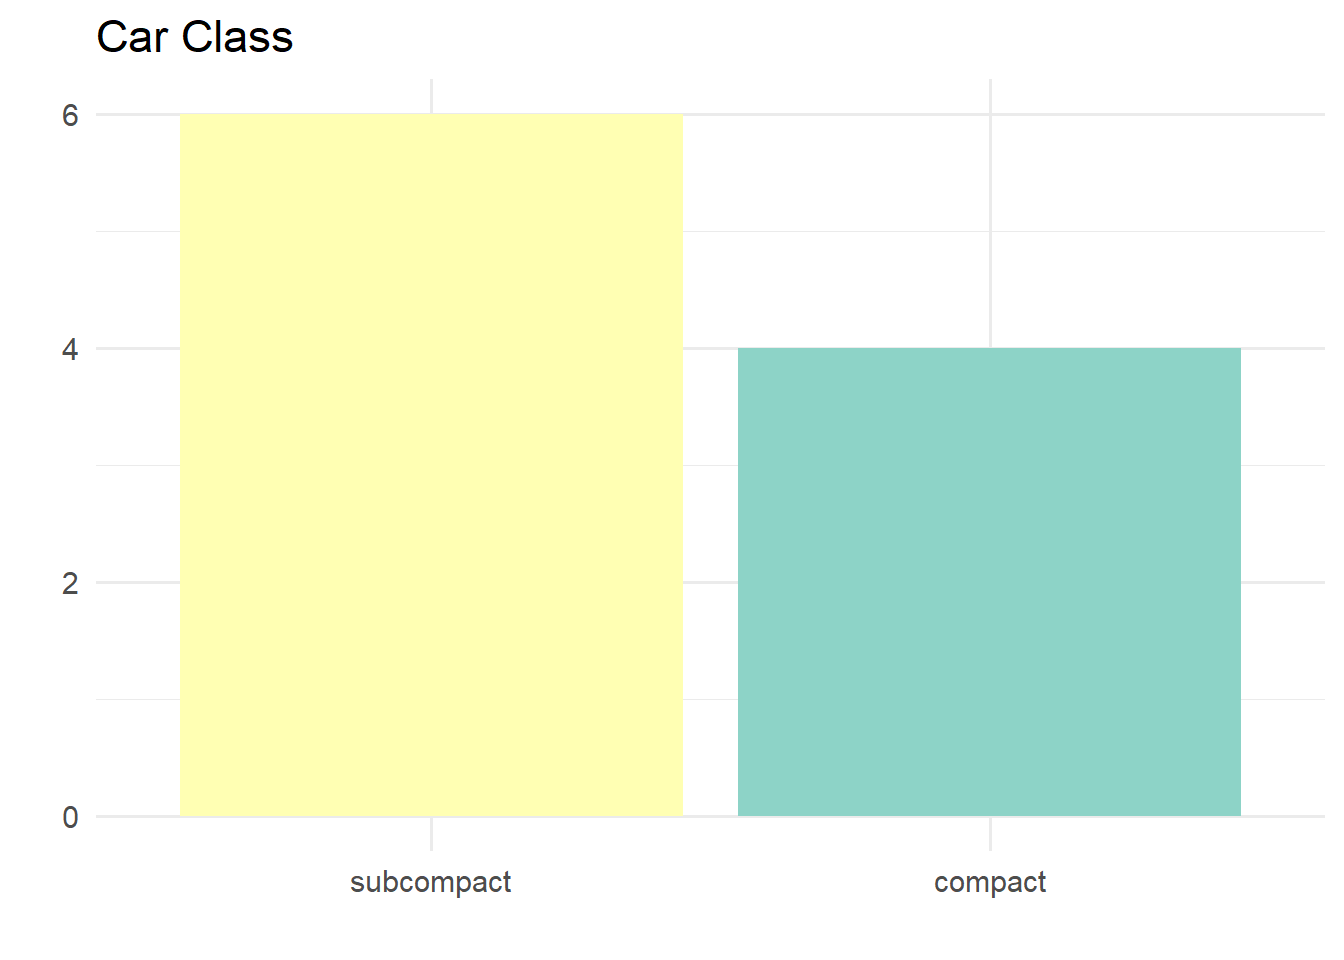
Assemble the plots
library(patchwork)
plot_car / (plot_mfr + plot_class)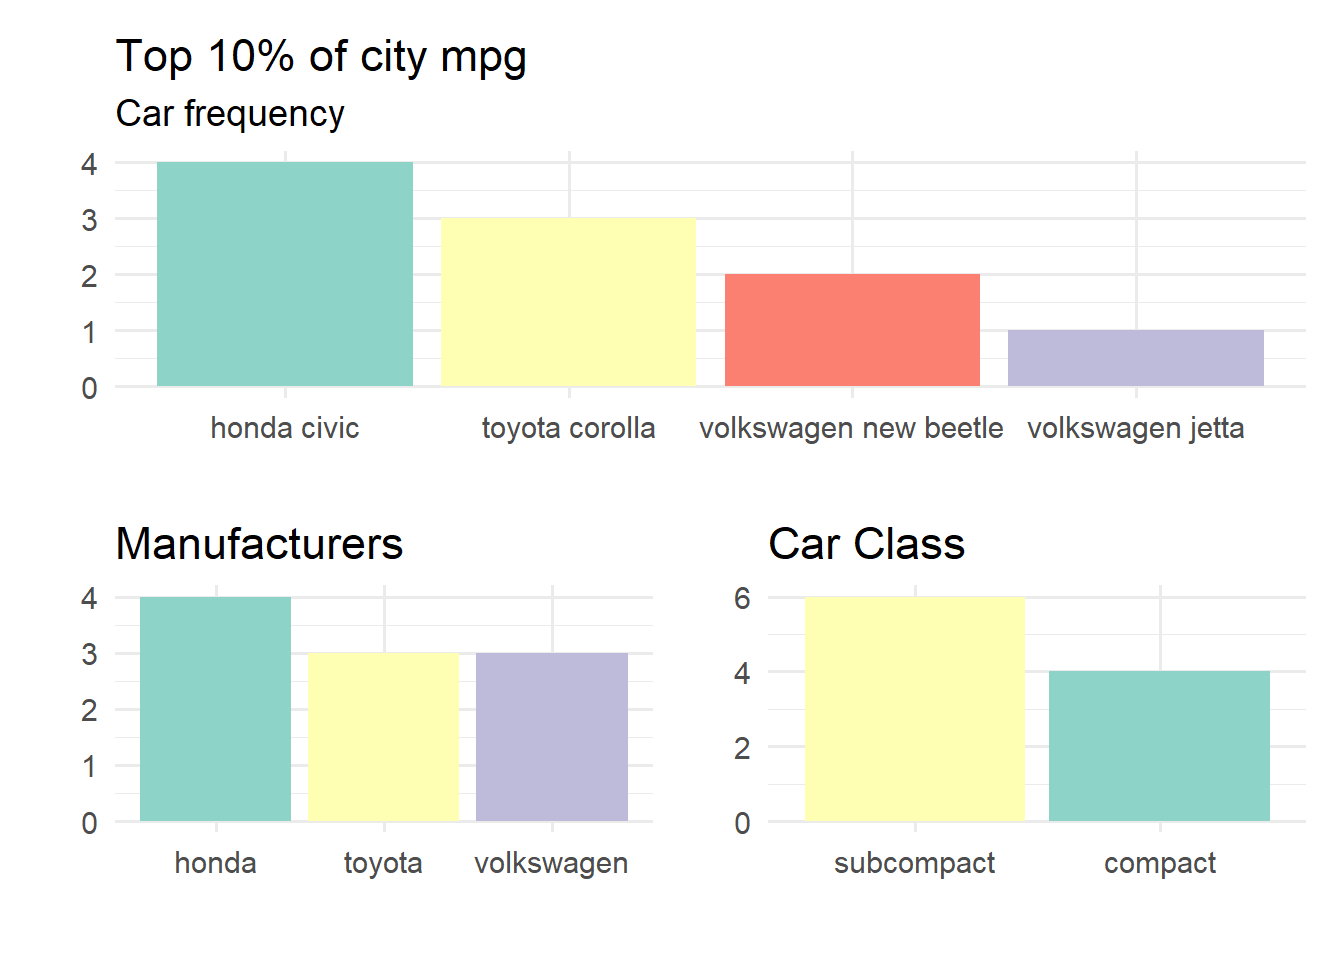
Functional Programming Version
At least in spirit
Let’s Expand from 4 cyl
We did a trial run with one piece (4 cyl), now let’s do some functional programming and apply it to all cyl groups
by_cyl <- split(mpg, mpg$cyl). . .
And filter all
top_10 <- lapply(by_cyl, function(x) {
filter(x, cty >= quantile(cty, probs = 0.9))
})
str(top_10)List of 4
$ 4: tibble [10 × 11] (S3: tbl_df/tbl/data.frame)
..$ manufacturer: chr [1:10] "honda" "honda" "honda" "honda" ...
..$ model : chr [1:10] "civic" "civic" "civic" "civic" ...
..$ displ : num [1:10] 1.6 1.6 1.8 1.8 1.8 1.8 1.8 1.9 1.9 1.9
..$ year : int [1:10] 1999 1999 2008 2008 1999 2008 2008 1999 1999 1999
..$ cyl : int [1:10] 4 4 4 4 4 4 4 4 4 4
..$ trans : chr [1:10] "manual(m5)" "manual(m5)" "manual(m5)" "auto(l5)" ...
..$ drv : chr [1:10] "f" "f" "f" "f" ...
..$ cty : int [1:10] 28 25 26 25 26 28 26 33 35 29
..$ hwy : int [1:10] 33 32 34 36 35 37 35 44 44 41
..$ fl : chr [1:10] "r" "r" "r" "r" ...
..$ class : chr [1:10] "subcompact" "subcompact" "subcompact" "subcompact" ...
$ 5: tibble [2 × 11] (S3: tbl_df/tbl/data.frame)
..$ manufacturer: chr [1:2] "volkswagen" "volkswagen"
..$ model : chr [1:2] "jetta" "jetta"
..$ displ : num [1:2] 2.5 2.5
..$ year : int [1:2] 2008 2008
..$ cyl : int [1:2] 5 5
..$ trans : chr [1:2] "auto(s6)" "manual(m5)"
..$ drv : chr [1:2] "f" "f"
..$ cty : int [1:2] 21 21
..$ hwy : int [1:2] 29 29
..$ fl : chr [1:2] "r" "r"
..$ class : chr [1:2] "compact" "compact"
$ 6: tibble [23 × 11] (S3: tbl_df/tbl/data.frame)
..$ manufacturer: chr [1:23] "audi" "audi" "chevrolet" "chevrolet" ...
..$ model : chr [1:23] "a4" "a4" "malibu" "malibu" ...
..$ displ : num [1:23] 2.8 3.1 3.1 3.5 3.8 3.8 2.5 2.5 3.3 3.5 ...
..$ year : int [1:23] 1999 2008 1999 2008 1999 1999 1999 1999 2008 2008 ...
..$ cyl : int [1:23] 6 6 6 6 6 6 6 6 6 6 ...
..$ trans : chr [1:23] "manual(m5)" "auto(av)" "auto(l4)" "auto(l4)" ...
..$ drv : chr [1:23] "f" "f" "f" "f" ...
..$ cty : int [1:23] 18 18 18 18 18 18 18 18 19 19 ...
..$ hwy : int [1:23] 26 27 26 29 26 25 26 26 28 27 ...
..$ fl : chr [1:23] "p" "p" "r" "r" ...
..$ class : chr [1:23] "compact" "compact" "midsize" "midsize" ...
$ 8: tibble [11 × 11] (S3: tbl_df/tbl/data.frame)
..$ manufacturer: chr [1:11] "audi" "chevrolet" "chevrolet" "chevrolet" ...
..$ model : chr [1:11] "a6 quattro" "corvette" "corvette" "corvette" ...
..$ displ : num [1:11] 4.2 5.7 5.7 6.2 6.2 7 4.6 4.6 4.6 4.6 ...
..$ year : int [1:11] 2008 1999 1999 2008 2008 2008 1999 1999 2008 2008 ...
..$ cyl : int [1:11] 8 8 8 8 8 8 8 8 8 8 ...
..$ trans : chr [1:11] "auto(s6)" "manual(m6)" "auto(l4)" "manual(m6)" ...
..$ drv : chr [1:11] "4" "r" "r" "r" ...
..$ cty : int [1:11] 16 16 15 16 15 15 15 15 15 15 ...
..$ hwy : int [1:11] 23 26 23 26 25 24 21 22 23 22 ...
..$ fl : chr [1:11] "p" "p" "p" "p" ...
..$ class : chr [1:11] "midsize" "2seater" "2seater" "2seater" ...Counts for all
More complex anonymous function here
counts <- lapply(top_10, function(x) {
count_manufacturer <- count(x, manufacturer)
count_class <- count(x, class)
count_model <- count(x, manufacturer, model) |>
unite(car, manufacturer, model, sep = " ")
return(list(mfr = count_manufacturer,
car = count_model,
class = count_class))
})
counts$`4`
$`4`$mfr
# A tibble: 3 × 2
  manufacturer     n
  <chr>        <int>
1 honda            4
2 toyota           3
3 volkswagen       3
$`4`$car
# A tibble: 4 × 2
car n
<chr> <int>
1 honda civic 4
2 toyota corolla 3
3 volkswagen jetta 1
4 volkswagen new beetle 2
$`4`$class
# A tibble: 2 × 2
  class          n
  <chr>      <int>
1 compact        4
2 subcompact     6
$`5`
$`5`$mfr
# A tibble: 1 × 2
manufacturer n
<chr> <int>
1 volkswagen 2
$`5`$car
# A tibble: 1 × 2
car n
<chr> <int>
1 volkswagen jetta 2
$`5`$class
# A tibble: 1 × 2
class n
<chr> <int>
1 compact 2
$`6`
$`6`$mfr
# A tibble: 8 × 2
manufacturer n
<chr> <int>
1 audi 2
2 chevrolet 2
3 ford 2
4 hyundai 3
5 nissan 5
6 pontiac 2
7 toyota 6
8 volkswagen 1
$`6`$car
# A tibble: 10 × 2
car n
<chr> <int>
1 audi a4 2
2 chevrolet malibu 2
3 ford mustang 2
4 hyundai sonata 3
5 nissan altima 2
6 nissan maxima 3
7 pontiac grand prix 2
8 toyota camry 3
9 toyota camry solara 3
10 volkswagen passat 1
$`6`$class
# A tibble: 3 × 2
class n
<chr> <int>
1 compact 5
2 midsize 16
3 subcompact 2
$`8`
$`8`$mfr
# A tibble: 4 × 2
manufacturer n
<chr> <int>
1 audi 1
2 chevrolet 5
3 ford 4
4 pontiac 1
$`8`$car
# A tibble: 4 × 2
car n
<chr> <int>
1 audi a6 quattro 1
2 chevrolet corvette 5
3 ford mustang 4
4 pontiac grand prix 1
$`8`$class
# A tibble: 3 × 2
class n
<chr> <int>
1 2seater 5
2 midsize 2
3 subcompact 4Plots for all
Let’s write a couple functions
(we’ll mostly ignore how for now)
counts_plot <- function(counts_df) {

  var <- names(counts_df)[1]

  p <- ggplot(counts_df, aes(fct_reorder(!!sym(var), -n), n)) +
        geom_col(aes(fill = !!sym(var))) +
        scale_fill_brewer(palette = "Set3") +
        labs(title = stringr::str_to_title(var),
             x = "",
             y = "") +
        guides(fill = "none") +
    theme(axis.text.x = element_text(angle = 45, hjust = 1))

    if(var == "car") {
        p <- p + labs(title = "Top 10% of city mpg",
                      subtitle = var)
    }
 p
}
Test it “4”
counts_plot(counts[["4"]]$mfr)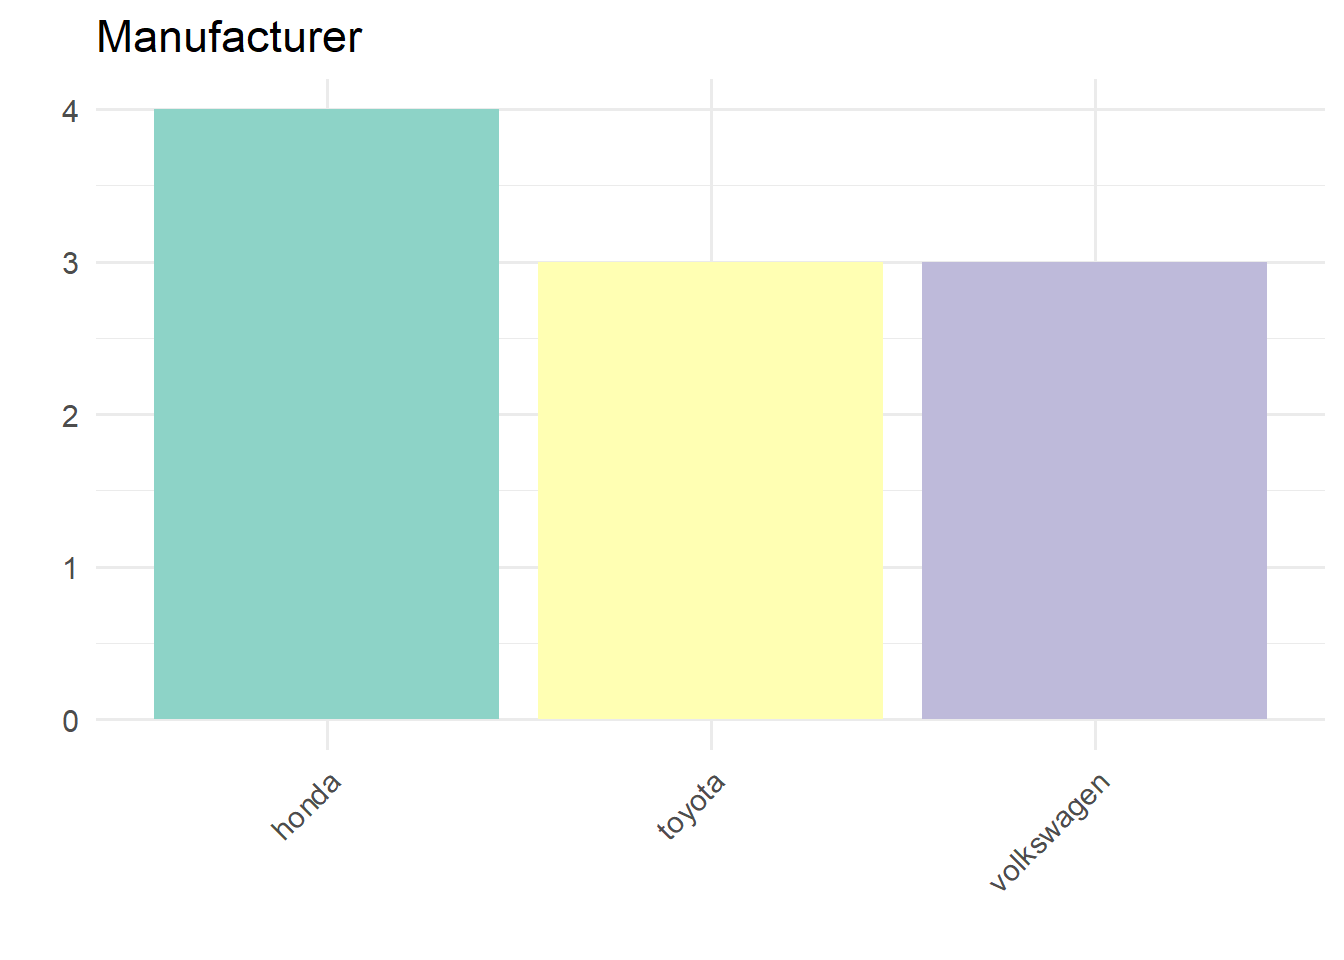
Test it “6”
counts_plot(counts[["6"]]$class) 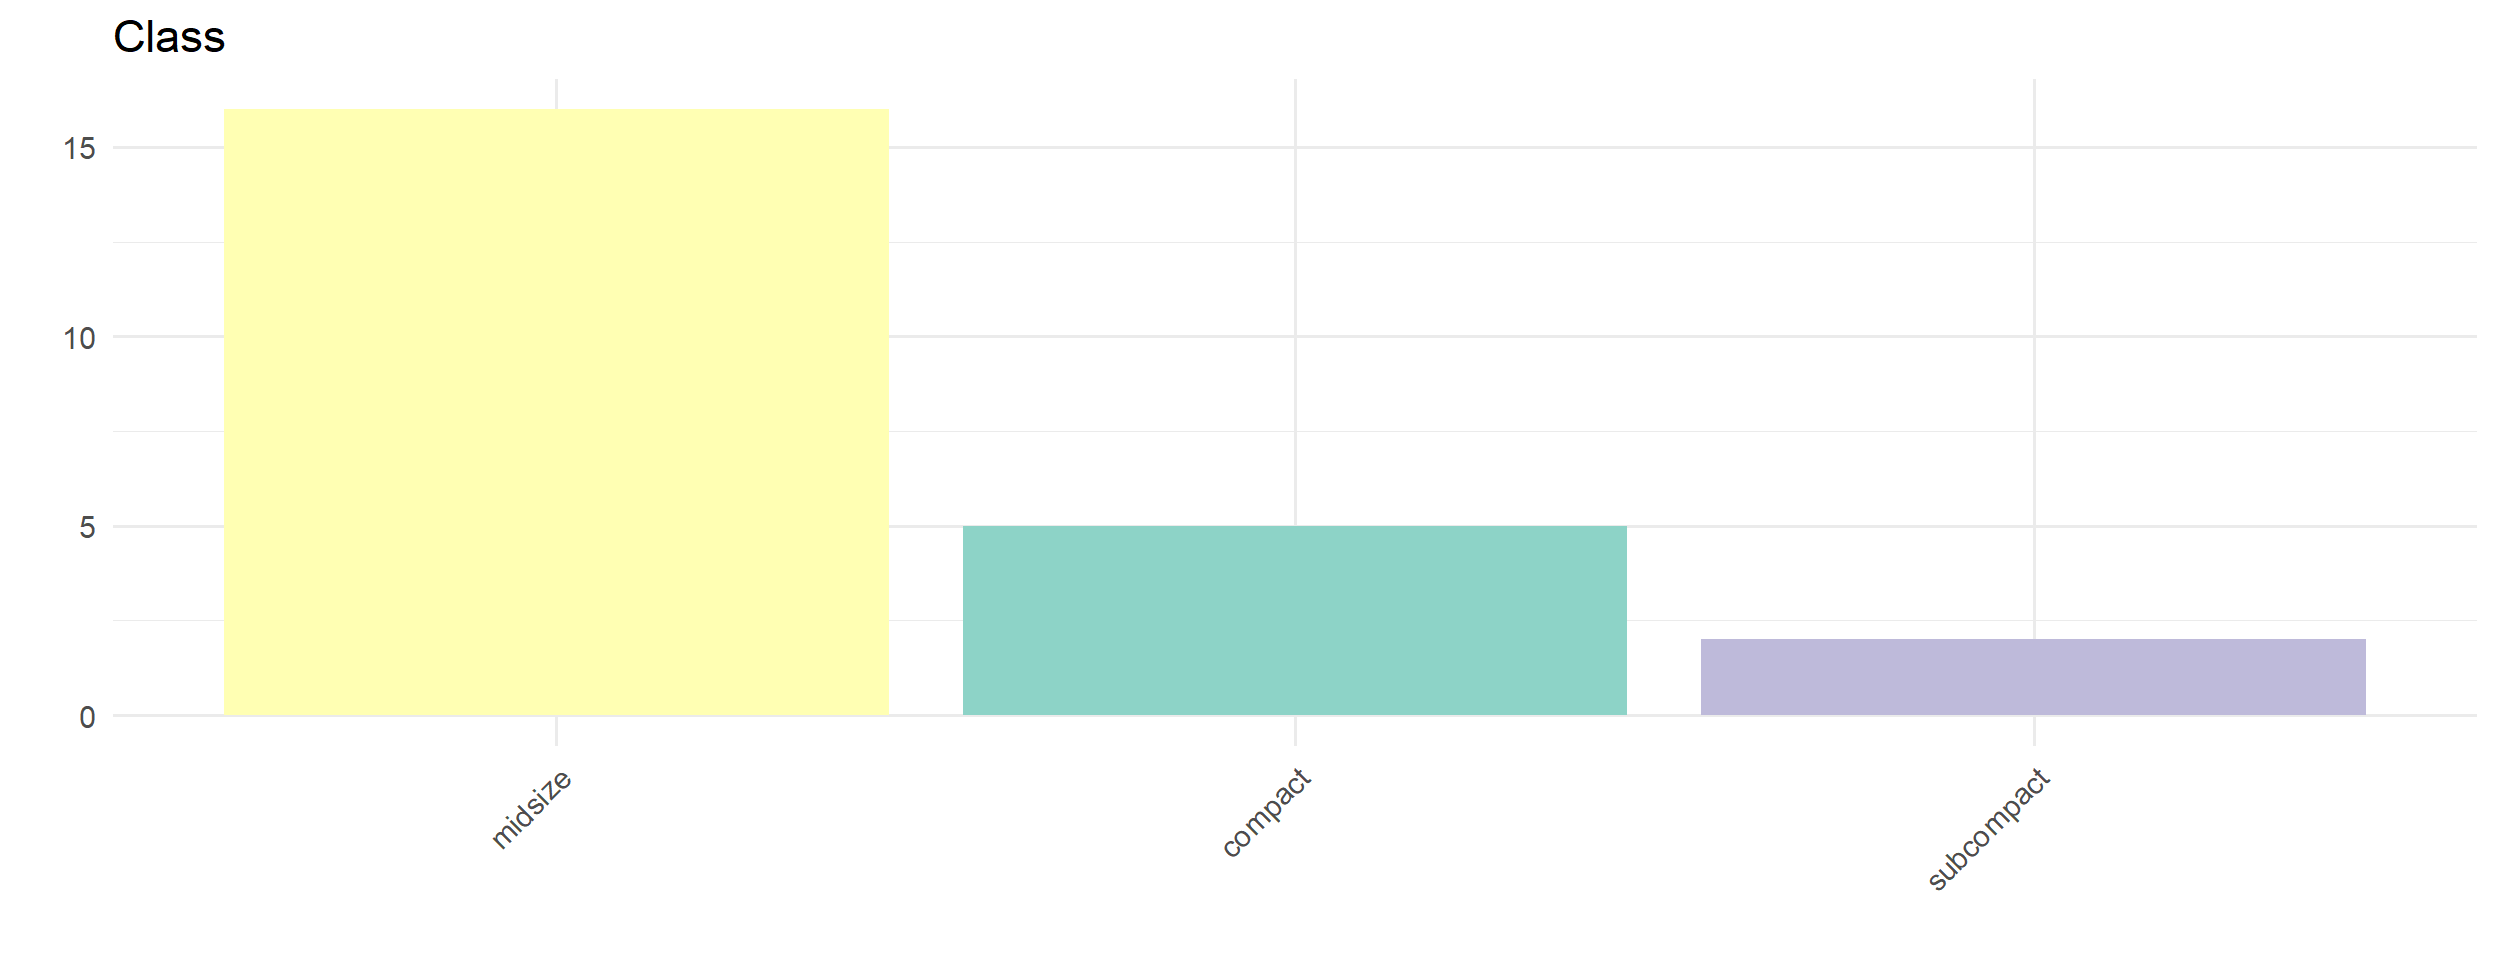
Test it “8”
counts_plot(counts[["8"]]$car)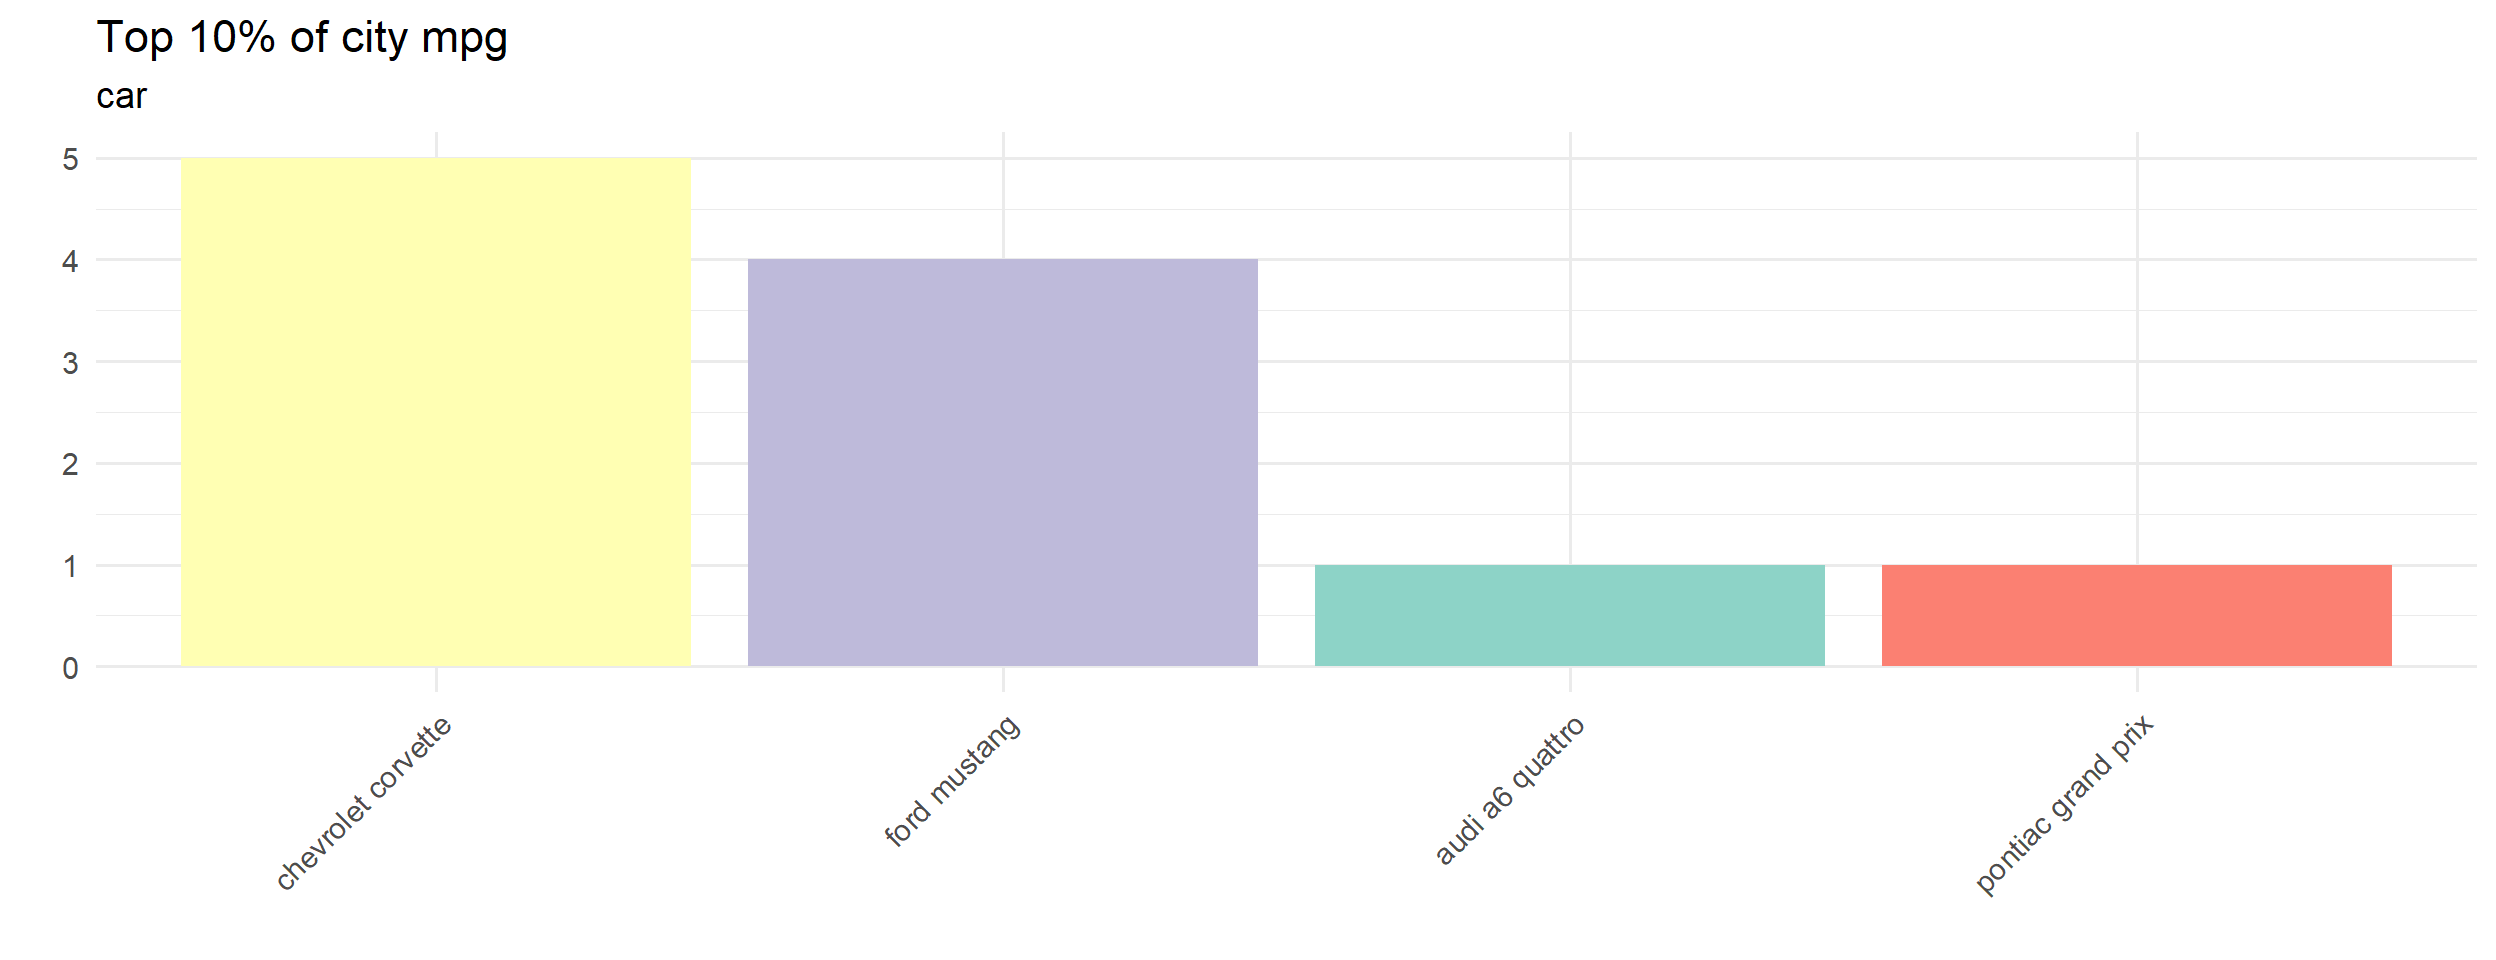
Compile plots function
full_plot <- function(l) {
    counts_plot(l[["car"]]) / (
      counts_plot(l[["mfr"]]) +
      counts_plot(l[["class"]])
    )
}
Test it
full_plot(counts[[1]])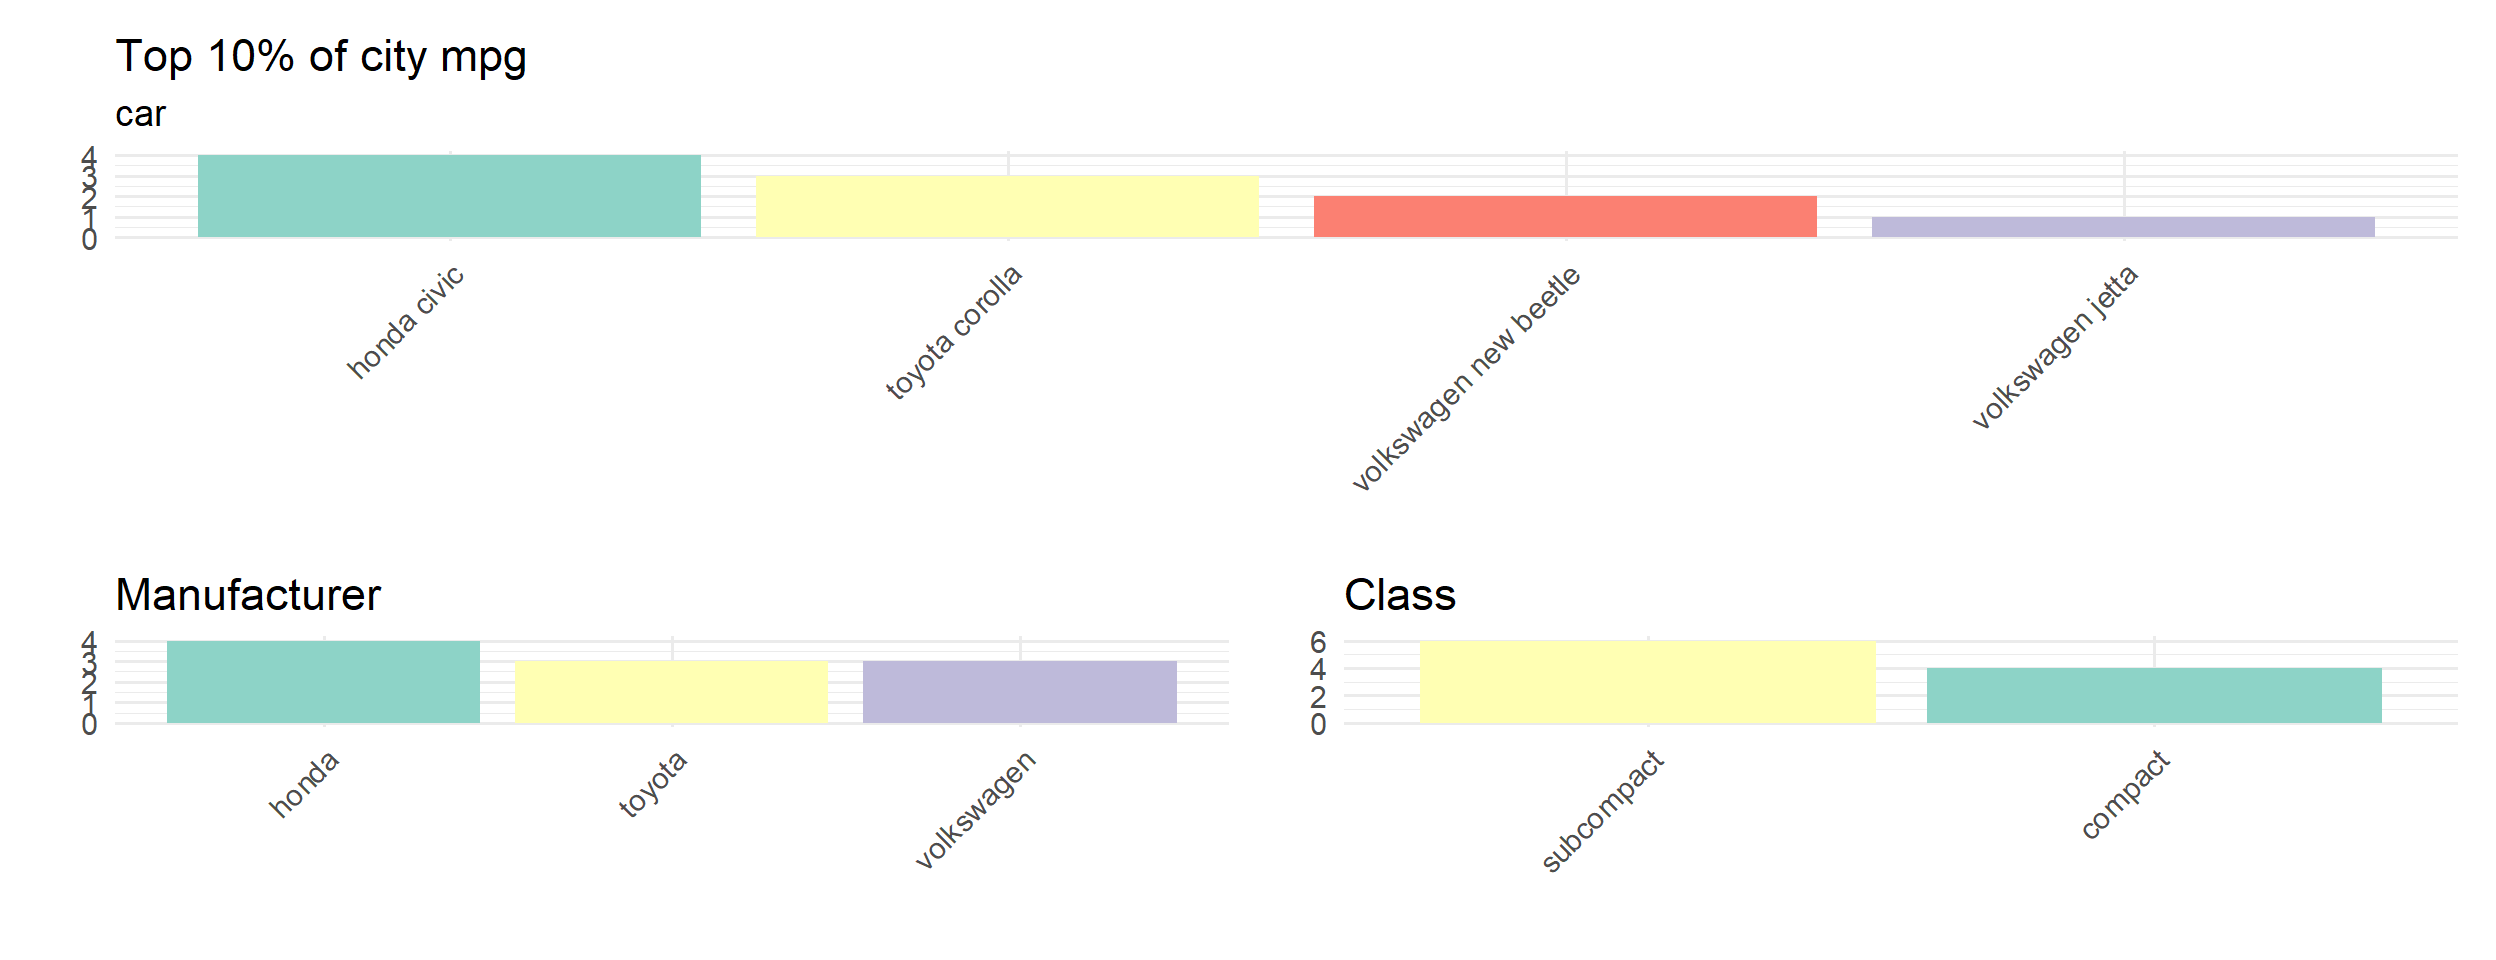
Finish up
plots <- lapply(counts, full_plot)4 cyl (1)
plots[[1]]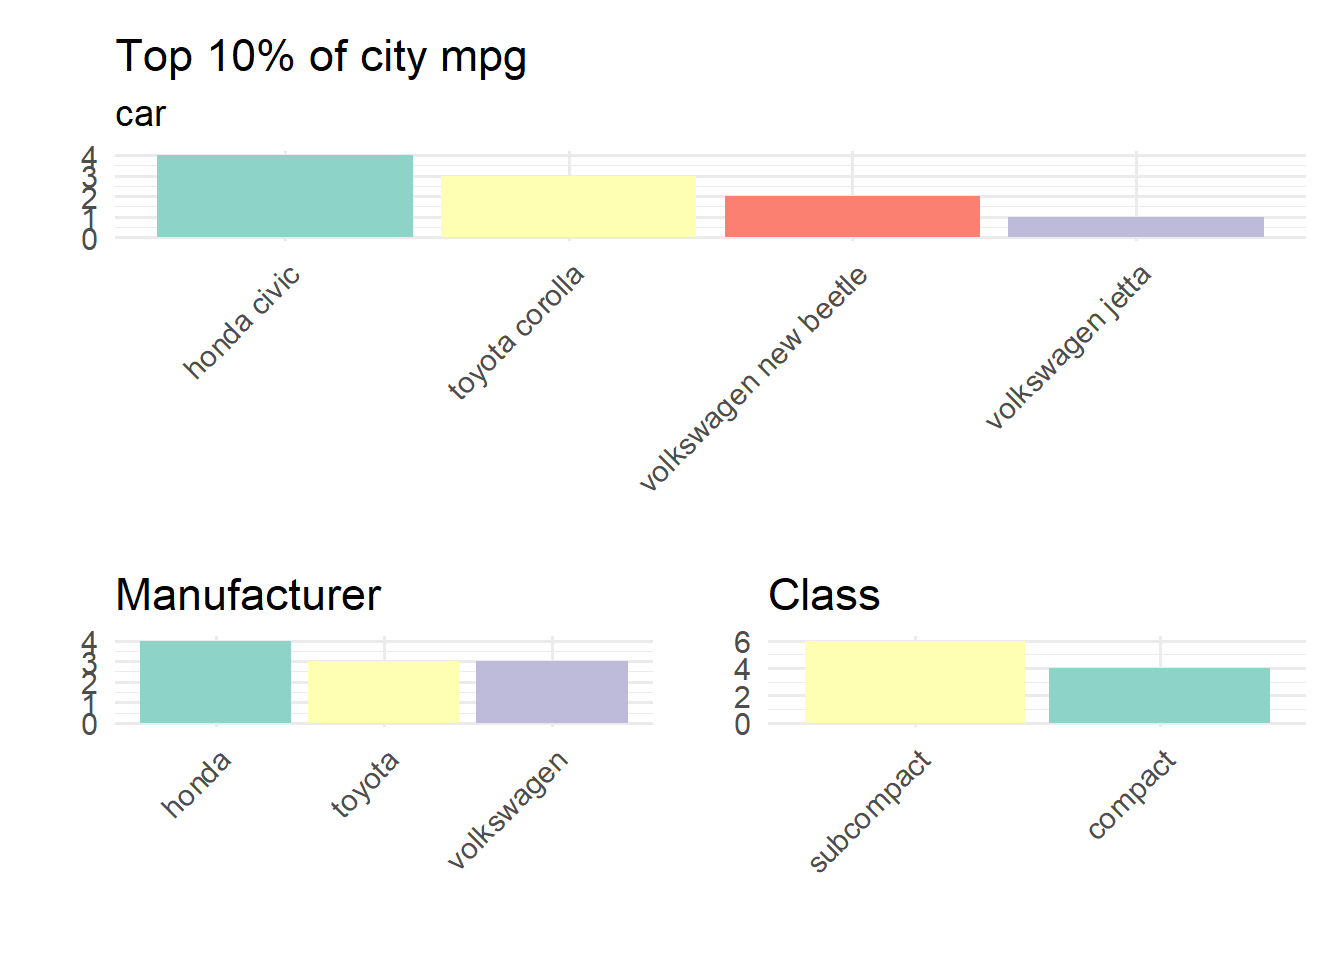
5 cyl (2)
plots[[2]]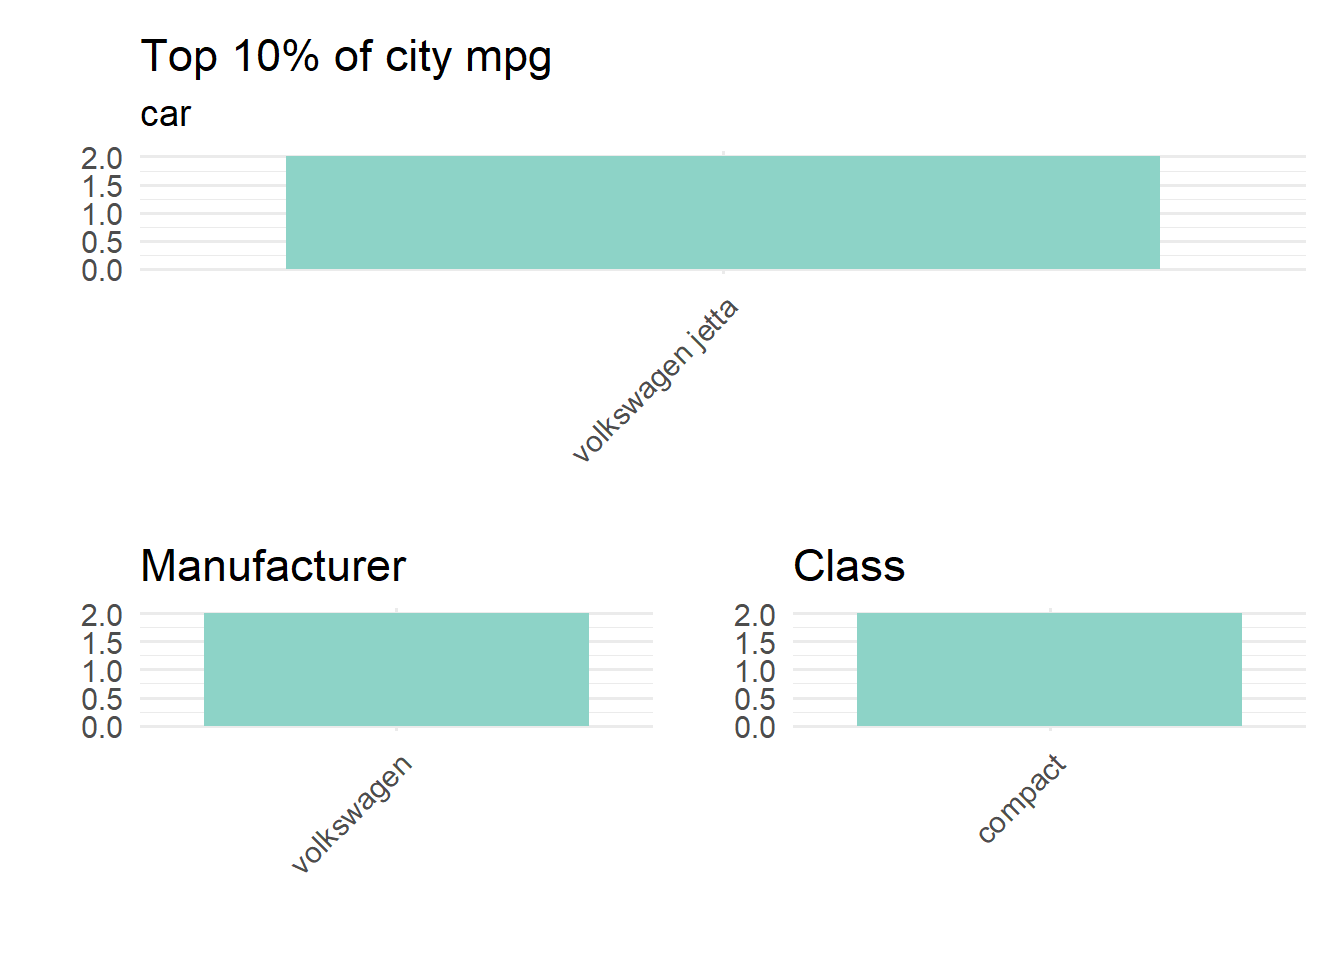
6 cyl (3)
plots[[3]]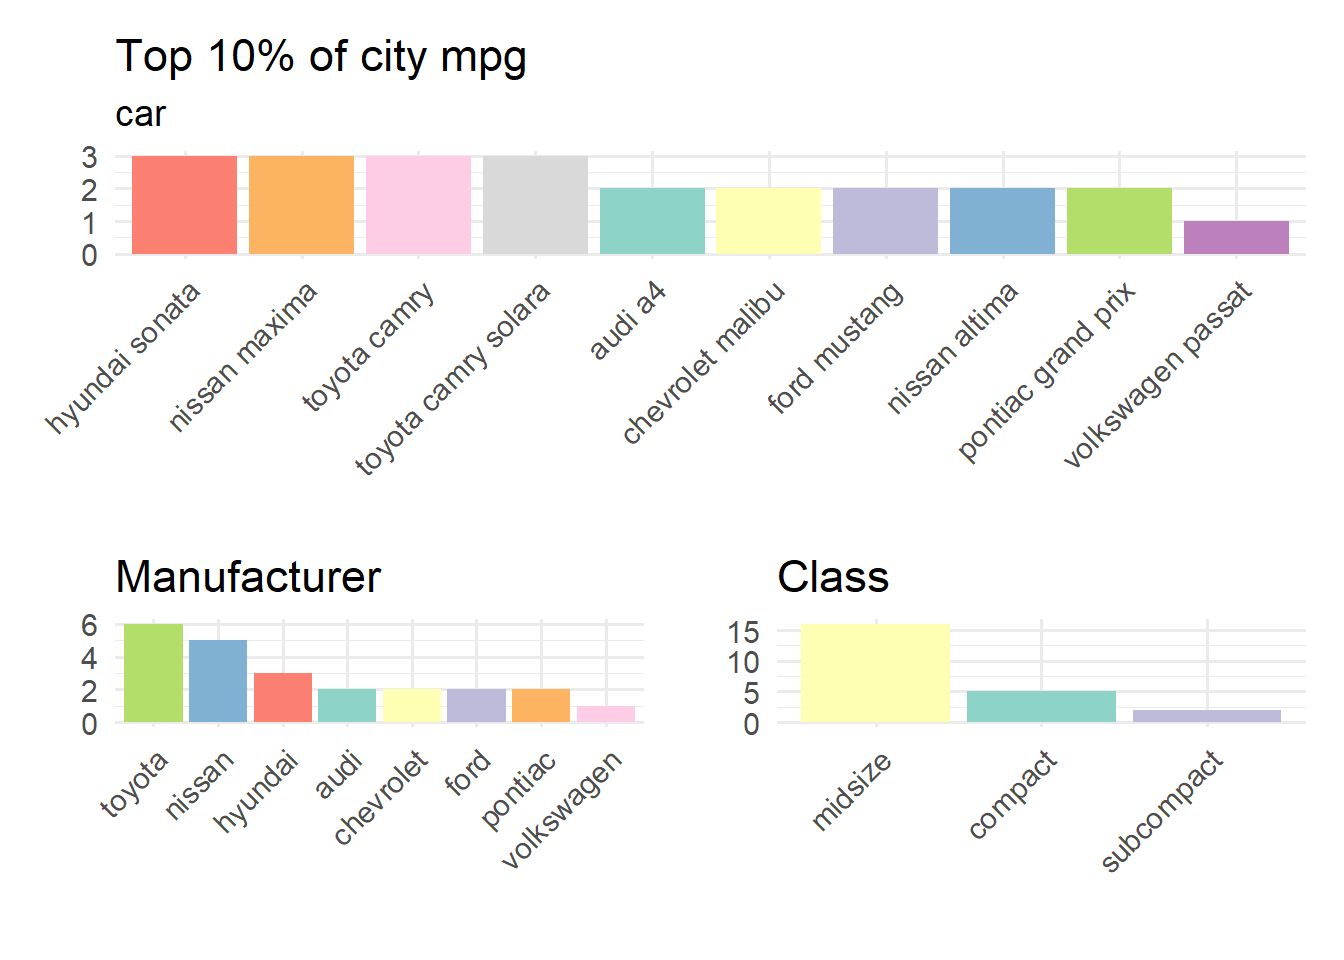
8 cyl (4)
plots[[4]]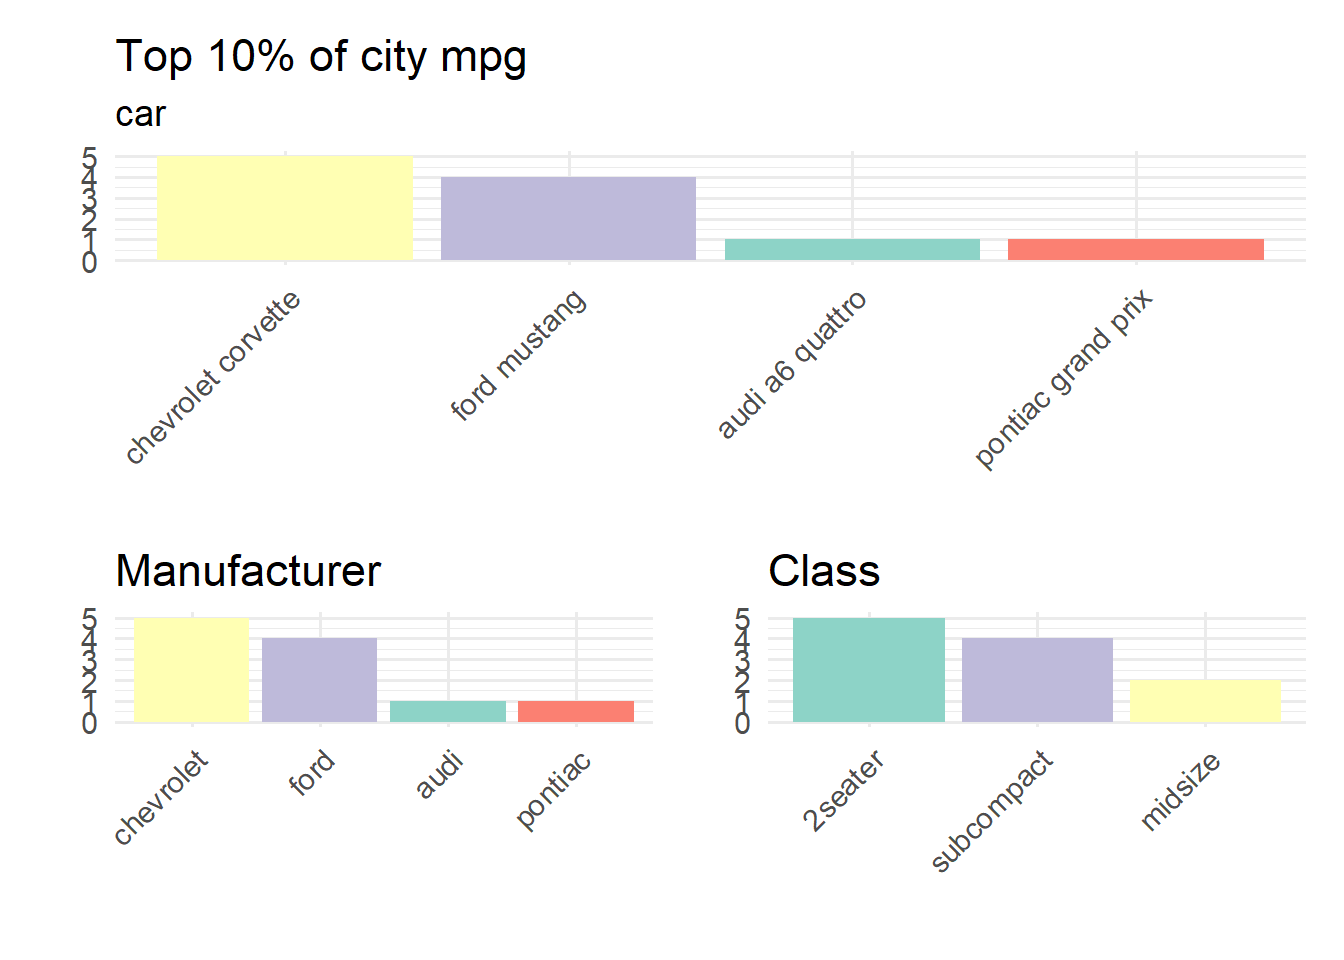
{purrr}
Functionals
- functional
- “a function that takes a function as input and returns a vector as output”
. . .
You remember from last week and lapply() et al.
purrr::map()
library(purrr) # loaded automatically with library(tidyverse)
map(1:3, rnorm)
[[1]]
[1] -0.7343803
[[2]]
[1] 0.5394204 -0.2436382
[[3]]
[1] -0.425156 -1.689734 1.036313Graphically
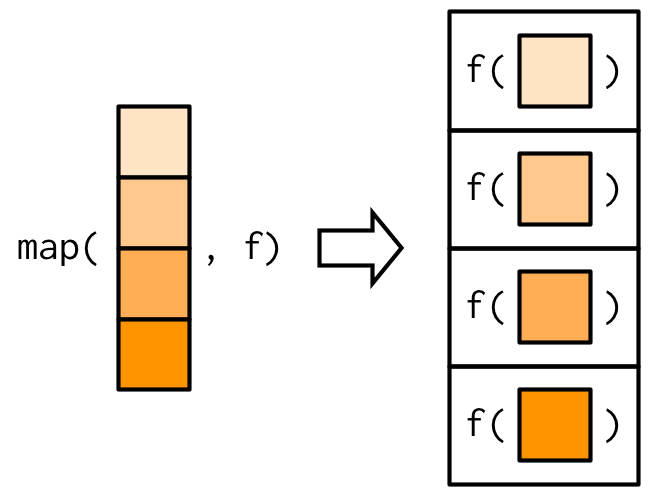
Comparison to base::lapply()
lapply()
lapply(1:3, rnorm)[[1]]
[1] 1.523724
[[2]]
[1] -0.4173061 -1.6324232
[[3]]
[1] 0.5623075 -0.7353186 0.7508274map()
map(1:3, rnorm)[[1]]
[1] 0.3064929
[[2]]
[1] -0.3705654 0.1049110
[[3]]
[1] 1.6357612 1.1316940 -0.2074827side note: What exactly is going on here?
map() & lapply()
The base equivalent to
map()islapply(). The only difference is thatlapply()does not support the helpers that you’ll learn about (next), so if you’re only usingmap()from{purrr}, you can skip the additional dependency and uselapply()directly.
- Adv R
Equivalents
The following are equivalent
map(mtcars, function(x) length(unique(x)))

lapply(mtcars, function(x) length(unique(x)))
EXPLAIN .X
So why
But {purrr} also allows you to specify anonymous functions more succinctly using the formula interface
. . .
From this:
map(mtcars, function(x) length(unique(x)))To this:
map(mtcars, ~length(unique(.x)))$mpg
[1] 25
$cyl
[1] 3
$disp
[1] 27
$hp
[1] 22
$drat
[1] 22
$wt
[1] 29
$qsec
[1] 30
$vs
[1] 2
$am
[1] 2
$gear
[1] 3
$carb
[1] 6. . .
If you forget the ~ (I do sometimes!)
map(mtcars, length(unique(.x)))Error:
! object '.x' not foundAnonymous function?
- An anonymous function is one that is defined without being given a name
- Since it has no name assigned with
<-, it’s anonymous - It’s usually created for short, one-time use—often inside another function like
lapply(),sapply(),purrr::map(), etc.
function(arguments) {
  # code
}
~ is used in place of function(x)
More examples
Vary the n
map(1:3, ~rnorm(n = .x))[[1]]
[1] 0.9557764
[[2]]
[1] -0.3952842 -0.4518243
[[3]]
[1] 0.3697117 0.4974838 -0.6173932Vary the mean
map(1:3, ~rnorm(n = 1, mean = .x))[[1]]
[1] 2.706037
[[2]]
[1] 3.207659
[[3]]
[1] 5.709939Vary the sd
map(1:3, ~rnorm(n = 1, sd = .x))[[1]]
[1] -0.3307834
[[2]]
[1] 0.9844692
[[3]]
[1] -0.0367064Remember lapply()
This doesn’t work
lapply(1:3, rnorm(n = x))Error:
! object 'x' not foundor this
lapply(1:3, ~rnorm(n = x))Error in `match.fun()`:
! '~rnorm(n = x)' is not a function, character or symbolIt has to be this
lapply(1:3, function(x) rnorm(n = x))[[1]]
[1] 0.2696294
[[2]]
[1] 0.1187362 0.4896607
[[3]]
[1] 0.9476157 -0.7585117 -0.5467824Extracting elements
Let’s make a complicated list
(l <- list(
  list(-1, x = 1, y = 2, z = "a"),
  list(-2, x = 4, y = c(5, 6), z = "b"),
  list(-3, x = 8, y = c(9, 10, 11))
))
[[1]]
[[1]][[1]]
[1] -1
[[1]]$x
[1] 1
[[1]]$y
[1] 2
[[1]]$z
[1] "a"
[[2]]
[[2]][[1]]
[1] -2
[[2]]$x
[1] 4
[[2]]$y
[1] 5 6
[[2]]$z
[1] "b"
[[3]]
[[3]][[1]]
[1] -3
[[3]]$x
[1] 8
[[3]]$y
[1] 9 10 11Extract second element from each
map() 😎
map(l, 2)[[1]]
[1] 1
[[2]]
[1] 4
[[3]]
[1] 8lapply 👎
lapply(l, 2)Error in `match.fun()`:
! '2' is not a function, character or symbolDoesn’t work with lapply()
Instead, you have to apply an anonymous function
lapply(l, function(x) x[[2]])[[1]]
[1] 1
[[2]]
[1] 4
[[3]]
[1] 8. . .
Alternatively the following is also the same (and my brain hates it)
lapply(l, `[[`, 2)Extract by name
map(l, "y")[[1]]
[1] 2
[[2]]
[1] 5 6
[[3]]
[1] 9 10 11Multiple arguments
Extract first element 1 from y
map(l, list("y", 1))[[1]]
[1] 2
[[2]]
[1] 5
[[3]]
[1] 9{purrr} variants
Return a vector
And specify the type
map_dbl()map_int()map_chr()map_lgl()
l
str(l)List of 3
$ :List of 4
..$ : num -1
..$ x: num 1
..$ y: num 2
..$ z: chr "a"
$ :List of 4
..$ : num -2
..$ x: num 4
..$ y: num [1:2] 5 6
..$ z: chr "b"
$ :List of 3
..$ : num -3
..$ x: num 8
..$ y: num [1:3] 9 10 11map_*
map(l, "x")[[1]]
[1] 1
[[2]]
[1] 4
[[3]]
[1] 8map_dbl(l, "x")[1] 1 4 8map_dbl(l, 1)[1] -1 -2 -3Type Match
You’ll get an error for coercion
map_chr(l, "x")Error in `map_chr()`:
ℹ In index: 1.
Caused by error:
! Can't coerce from a number to a string.. . .
You have to explicitly coerce
map_chr(l, ~as.character(.x$x))[1] "1" "4" "8". . .
You’ll get an error if element doesn’t exist
map_chr(l, "z")Error in `map_chr()`:
ℹ In index: 3.
Caused by error:
! Result must be length 1, not 0.. . .
Unless you set a default value
map_chr(l, "z", .default = NA_character_)[1] "a" "b" NA Quick note: missing values
- In the prior case, specifying
NAwould work, instead ofNA_character_ - Generally, I think it’s better to specify the type
- General programming rule: The more strict the better
- Because (base)
Rlikes to be inconsistent, here are theNAtypes
. . .
| Type | NA value |
|---|---|
| character | NA_character_ |
| integer | NA_integer_ |
| double | NA_real_ |
| logical | NA (see here) |
. . .
typeof(NA)[1] "logical"More quick examples
Please copy the code below so you have it locally
df_list <- list(
  data.frame(var1 = 1:5),
  data.frame(var1 = 1:3),
  data.frame(var1 = 1)
)
Compute mean(var1)
For each data frame. You try first!
Answer
map(df_list, ~mean(.x$var1))[[1]]
[1] 3
[[2]]
[1] 2
[[3]]
[1] 1. . .
Return a vector
map_dbl(df_list, ~mean(.x$var1))[1] 3 2 1Some more examples
Please follow along
econ <- economics |>
    mutate(year = lubridate::year(date))
econ
# A tibble: 574 × 7
date pce pop psavert uempmed unemploy year
<date> <dbl> <dbl> <dbl> <dbl> <dbl> <dbl>
1 1967-07-01 507. 198712 12.6 4.5 2944 1967
2 1967-08-01 510. 198911 12.6 4.7 2945 1967
3 1967-09-01 516. 199113 11.9 4.6 2958 1967
4 1967-10-01 512. 199311 12.9 4.9 3143 1967
5 1967-11-01 517. 199498 12.8 4.7 3066 1967
6 1967-12-01 525. 199657 11.8 4.8 3018 1967
7 1968-01-01 531. 199808 11.7 5.1 2878 1968
8 1968-02-01 534. 199920 12.3 4.5 3001 1968
9 1968-03-01 544. 200056 11.7 4.1 2877 1968
10 1968-04-01 544 200208 12.3 4.6 2709 1968
# ℹ 564 more rowsLet’s fit a simple model to each year
Caveats
- We’ll discuss a more elegant way to do this later
- This is not (statistically) the best way to approach this problem
- It’s a good illustration, and in my experience there are lots of times where this approach works well, even if this particular example is a bit artificial
split by year
by_year <- split(econ, econ$year)
str(by_year)
List of 49
$ 1967: tibble [6 × 7] (S3: tbl_df/tbl/data.frame)
..$ date : Date[1:6], format: "1967-07-01" "1967-08-01" ...
..$ pce : num [1:6] 507 510 516 512 517 ...
..$ pop : num [1:6] 198712 198911 199113 199311 199498 ...
..$ psavert : num [1:6] 12.6 12.6 11.9 12.9 12.8 11.8
..$ uempmed : num [1:6] 4.5 4.7 4.6 4.9 4.7 4.8
..$ unemploy: num [1:6] 2944 2945 2958 3143 3066 ...
..$ year : num [1:6] 1967 1967 1967 1967 1967 ...
$ 1968: tibble [12 × 7] (S3: tbl_df/tbl/data.frame)
..$ date : Date[1:12], format: "1968-01-01" "1968-02-01" ...
..$ pce : num [1:12] 531 534 544 544 550 ...
..$ pop : num [1:12] 2e+05 2e+05 2e+05 2e+05 2e+05 ...
..$ psavert : num [1:12] 11.7 12.3 11.7 12.3 12 11.7 10.7 10.5 10.6 10.8 ...
..$ uempmed : num [1:12] 5.1 4.5 4.1 4.6 4.4 4.4 4.5 4.2 4.6 4.8 ...
..$ unemploy: num [1:12] 2878 3001 2877 2709 2740 ...
..$ year : num [1:12] 1968 1968 1968 1968 1968 ...
$ 1969: tibble [12 × 7] (S3: tbl_df/tbl/data.frame)
..$ date : Date[1:12], format: "1969-01-01" "1969-02-01" ...
..$ pce : num [1:12] 584 589 589 594 600 ...
..$ pop : num [1:12] 201760 201881 202023 202161 202331 ...
..$ psavert : num [1:12] 10.3 9.7 10.2 9.7 10.1 11.1 11.8 11.5 11.6 11.4 ...
..$ uempmed : num [1:12] 4.4 4.9 4 4 4.2 4.4 4.4 4.4 4.7 4.5 ...
..$ unemploy: num [1:12] 2718 2692 2712 2758 2713 ...
..$ year : num [1:12] 1969 1969 1969 1969 1969 ...
$ 1970: tibble [12 × 7] (S3: tbl_df/tbl/data.frame)
..$ date : Date[1:12], format: "1970-01-01" "1970-02-01" ...
..$ pce : num [1:12] 629 634 632 636 642 ...
..$ pop : num [1:12] 203849 204008 204156 204401 204607 ...
..$ psavert : num [1:12] 11.8 11.7 12.4 13.3 12.4 12.3 13.5 13.4 12.9 13.1 ...
..$ uempmed : num [1:12] 4.6 4.5 4.6 4.1 4.7 4.9 5.1 5.4 5.2 5.2 ...
..$ unemploy: num [1:12] 3201 3453 3635 3797 3919 ...
..$ year : num [1:12] 1970 1970 1970 1970 1970 1970 1970 1970 1970 1970 ...
$ 1971: tibble [12 × 7] (S3: tbl_df/tbl/data.frame)
..$ date : Date[1:12], format: "1971-01-01" "1971-02-01" ...
..$ pce : num [1:12] 676 679 682 689 691 ...
..$ pop : num [1:12] 206466 206668 206855 207065 207260 ...
..$ psavert : num [1:12] 13.3 13.3 13.5 13.2 13.6 14.7 13.8 13.6 13.3 13.3 ...
..$ uempmed : num [1:12] 6.2 6.3 6.4 6.5 6.7 5.7 6.2 6.4 5.8 6.5 ...
..$ unemploy: num [1:12] 4986 4903 4987 4959 4996 ...
..$ year : num [1:12] 1971 1971 1971 1971 1971 ...
$ 1972: tibble [12 × 7] (S3: tbl_df/tbl/data.frame)
..$ date : Date[1:12], format: "1972-01-01" "1972-02-01" ...
..$ pce : num [1:12] 732 736 749 752 758 ...
..$ pop : num [1:12] 208917 209061 209212 209386 209545 ...
..$ psavert : num [1:12] 12.5 12.8 11.8 11.5 11.7 11.7 11.7 12 12.2 13 ...
..$ uempmed : num [1:12] 6.2 6.6 6.6 6.7 6.6 5.4 6.1 6 5.6 5.7 ...
..$ unemploy: num [1:12] 5019 4928 5038 4959 4922 ...
..$ year : num [1:12] 1972 1972 1972 1972 1972 ...
$ 1973: tibble [12 × 7] (S3: tbl_df/tbl/data.frame)
..$ date : Date[1:12], format: "1973-01-01" "1973-02-01" ...
..$ pce : num [1:12] 816 826 833 836 842 ...
..$ pop : num [1:12] 210985 211120 211254 211420 211577 ...
..$ psavert : num [1:12] 12.4 12.5 12.7 13.2 13.2 13.6 13.2 13.9 13.1 14.4 ...
..$ uempmed : num [1:12] 5.7 5.2 5.5 5 4.9 5 5.2 4.9 5.4 5.5 ...
..$ unemploy: num [1:12] 4326 4452 4394 4459 4329 ...
..$ year : num [1:12] 1973 1973 1973 1973 1973 ...
$ 1974: tibble [12 × 7] (S3: tbl_df/tbl/data.frame)
..$ date : Date[1:12], format: "1974-01-01" "1974-02-01" ...
..$ pce : num [1:12] 884 890 901 911 922 ...
..$ pop : num [1:12] 212932 213074 213211 213361 213513 ...
..$ psavert : num [1:12] 14.3 14.2 13.4 13.1 12.8 12.8 12.8 12.1 12.9 13.4 ...
..$ uempmed : num [1:12] 5 5.1 4.8 5 4.6 5.3 5.7 5 5.3 5.5 ...
..$ unemploy: num [1:12] 4644 4731 4634 4618 4705 ...
..$ year : num [1:12] 1974 1974 1974 1974 1974 ...
$ 1975: tibble [12 × 7] (S3: tbl_df/tbl/data.frame)
..$ date : Date[1:12], format: "1975-01-01" "1975-02-01" ...
..$ pce : num [1:12] 976 989 991 995 1019 ...
..$ pop : num [1:12] 214931 215065 215198 215353 215523 ...
..$ psavert : num [1:12] 13.2 12.5 12.7 14.2 17.3 14.3 12.6 13 13 13.4 ...
..$ uempmed : num [1:12] 6.3 7.1 7.2 8.7 9.4 8.8 8.6 9.2 9.2 8.6 ...
..$ unemploy: num [1:12] 7501 7520 7978 8210 8433 ...
..$ year : num [1:12] 1975 1975 1975 1975 1975 ...
$ 1976: tibble [12 × 7] (S3: tbl_df/tbl/data.frame)
..$ date : Date[1:12], format: "1976-01-01" "1976-02-01" ...
..$ pce : num [1:12] 1107 1108 1115 1125 1123 ...
..$ pop : num [1:12] 217095 217249 217381 217528 217685 ...
..$ psavert : num [1:12] 11.7 12.3 12.2 11.7 12.3 11.4 11.7 11.7 11.4 11.1 ...
..$ uempmed : num [1:12] 9 8.2 8.7 8.2 8.3 7.8 7.7 7.9 7.8 7.7 ...
..$ unemploy: num [1:12] 7534 7326 7230 7330 7053 ...
..$ year : num [1:12] 1976 1976 1976 1976 1976 ...
$ 1977: tibble [12 × 7] (S3: tbl_df/tbl/data.frame)
..$ date : Date[1:12], format: "1977-01-01" "1977-02-01" ...
..$ pce : num [1:12] 1215 1231 1238 1247 1257 ...
..$ pop : num [1:12] 219179 219344 219504 219684 219859 ...
..$ psavert : num [1:12] 10.6 9.3 10.5 10.5 10.3 10.6 10.5 10.9 11.1 11 ...
..$ uempmed : num [1:12] 7.5 7.2 7.2 7.3 7.9 6.2 7.1 7 6.7 6.9 ...
..$ unemploy: num [1:12] 7280 7443 7307 7059 6911 ...
..$ year : num [1:12] 1977 1977 1977 1977 1977 ...
$ 1978: tibble [12 × 7] (S3: tbl_df/tbl/data.frame)
..$ date : Date[1:12], format: "1978-01-01" "1978-02-01" ...
..$ pce : num [1:12] 1330 1355 1378 1396 1412 ...
..$ pop : num [1:12] 221477 221629 221792 221991 222176 ...
..$ psavert : num [1:12] 11.9 11.1 11 10.8 10.3 10 10.9 10.5 10.6 10.7 ...
..$ uempmed : num [1:12] 6.5 6.7 6.2 6.1 5.7 6 5.8 5.8 5.6 5.9 ...
..$ unemploy: num [1:12] 6489 6318 6337 6180 6127 ...
..$ year : num [1:12] 1978 1978 1978 1978 1978 ...
$ 1979: tibble [12 × 7] (S3: tbl_df/tbl/data.frame)
..$ date : Date[1:12], format: "1979-01-01" "1979-02-01" ...
..$ pce : num [1:12] 1502 1518 1531 1538 1559 ...
..$ pop : num [1:12] 223865 224053 224235 224438 224632 ...
..$ psavert : num [1:12] 11.1 11.1 11.2 11 10.3 9.9 10.6 9.7 9.4 9.7 ...
..$ uempmed : num [1:12] 5.9 5.9 5.9 5.4 5.6 5.6 5.9 4.8 5.5 5.5 ...
..$ unemploy: num [1:12] 6109 6173 6109 6069 5840 ...
..$ year : num [1:12] 1979 1979 1979 1979 1979 ...
$ 1980: tibble [12 × 7] (S3: tbl_df/tbl/data.frame)
..$ date : Date[1:12], format: "1980-01-01" "1980-02-01" ...
..$ pce : num [1:12] 1697 1701 1708 1695 1700 ...
..$ pop : num [1:12] 226451 226656 226849 227061 227251 ...
..$ psavert : num [1:12] 9.9 10.1 10.2 11.3 11.4 11.2 11.3 11.3 11.7 11.3 ...
..$ uempmed : num [1:12] 5.3 5.8 6 5.8 5.7 6.4 7 7.5 7.7 7.5 ...
..$ unemploy: num [1:12] 6683 6702 6729 7358 7984 ...
..$ year : num [1:12] 1980 1980 1980 1980 1980 1980 1980 1980 1980 1980 ...
$ 1981: tibble [12 × 7] (S3: tbl_df/tbl/data.frame)
..$ date : Date[1:12], format: "1981-01-01" "1981-02-01" ...
..$ pce : num [1:12] 1870 1884 1903 1904 1914 ...
..$ pop : num [1:12] 228937 229071 229224 229403 229575 ...
..$ psavert : num [1:12] 10.9 10.8 10.8 10.9 11 10.8 12.3 12 12.4 13 ...
..$ uempmed : num [1:12] 7.4 7.1 7.1 7.4 6.9 6.6 7.1 7.2 6.8 6.8 ...
..$ unemploy: num [1:12] 8071 8051 7982 7869 8174 ...
..$ year : num [1:12] 1981 1981 1981 1981 1981 ...
$ 1982: tibble [12 × 7] (S3: tbl_df/tbl/data.frame)
..$ date : Date[1:12], format: "1982-01-01" "1982-02-01" ...
..$ pce : num [1:12] 1997 2021 2024 2026 2044 ...
..$ pop : num [1:12] 231157 231313 231470 231645 231809 ...
..$ psavert : num [1:12] 12.7 12.1 12.2 12.9 12.3 12.3 12.5 12.6 11.8 11.3 ...
..$ uempmed : num [1:12] 7.1 7.5 7.7 8.1 8.5 9.5 8.5 8.7 9.5 9.7 ...
..$ unemploy: num [1:12] 9397 9705 9895 10244 10335 ...
..$ year : num [1:12] 1982 1982 1982 1982 1982 ...
$ 1983: tibble [12 × 7] (S3: tbl_df/tbl/data.frame)
..$ date : Date[1:12], format: "1983-01-01" "1983-02-01" ...
..$ pce : num [1:12] 2174 2177 2203 2226 2246 ...
..$ pop : num [1:12] 233322 233473 233613 233781 233922 ...
..$ psavert : num [1:12] 11.1 11.1 10.6 10.3 9.9 9.1 9.6 9.2 9.6 9.7 ...
..$ uempmed : num [1:12] 11.1 9.8 10.4 10.9 12.3 11.3 10.1 9.3 9.3 9.4 ...
..$ unemploy: num [1:12] 11534 11545 11408 11268 11154 ...
..$ year : num [1:12] 1983 1983 1983 1983 1983 ...
$ 1984: tibble [12 × 7] (S3: tbl_df/tbl/data.frame)
..$ date : Date[1:12], format: "1984-01-01" "1984-02-01" ...
..$ pce : num [1:12] 2419 2404 2432 2458 2474 ...
..$ pop : num [1:12] 235385 235527 235675 235839 235993 ...
..$ psavert : num [1:12] 10 11.7 11.5 11.5 11.1 11.1 11.6 11.8 11.8 11.7 ...
..$ uempmed : num [1:12] 9.1 8.3 8.3 8.2 9.1 7.5 7.5 7.3 7.6 7.2 ...
..$ unemploy: num [1:12] 9008 8791 8746 8762 8456 ...
..$ year : num [1:12] 1984 1984 1984 1984 1984 ...
$ 1985: tibble [12 × 7] (S3: tbl_df/tbl/data.frame)
..$ date : Date[1:12], format: "1985-01-01" "1985-02-01" ...
..$ pce : num [1:12] 2619 2641 2648 2660 2696 ...
..$ pop : num [1:12] 237468 237602 237732 237900 238074 ...
..$ psavert : num [1:12] 10.3 9.1 8.7 9.9 11.1 9.6 9.1 8.2 7.3 9.1 ...
..$ uempmed : num [1:12] 6.8 7.1 7.1 6.9 6.9 6.6 6.9 7.1 6.9 7.1 ...
..$ unemploy: num [1:12] 8423 8321 8339 8395 8302 ...
..$ year : num [1:12] 1985 1985 1985 1985 1985 ...
$ 1986: tibble [12 × 7] (S3: tbl_df/tbl/data.frame)
..$ date : Date[1:12], format: "1986-01-01" "1986-02-01" ...
..$ pce : num [1:12] 2827 2820 2824 2835 2858 ...
..$ pop : num [1:12] 239638 239788 239928 240094 240271 ...
..$ psavert : num [1:12] 8.6 9.3 9.9 9.7 9.3 9.4 9.3 9 7.2 8.4 ...
..$ uempmed : num [1:12] 6.7 6.9 6.8 6.7 6.8 7 6.9 7.1 7.4 7 ...
..$ unemploy: num [1:12] 7795 8402 8383 8364 8439 ...
..$ year : num [1:12] 1986 1986 1986 1986 1986 ...
$ 1987: tibble [12 × 7] (S3: tbl_df/tbl/data.frame)
..$ date : Date[1:12], format: "1987-01-01" "1987-02-01" ...
..$ pce : num [1:12] 2936 3002 3013 3039 3048 ...
..$ pop : num [1:12] 241784 241930 242079 242252 242423 ...
..$ psavert : num [1:12] 9.7 8.5 8.5 4.5 8.2 7.7 7.5 7.2 7.6 8.3 ...
..$ uempmed : num [1:12] 6.9 6.6 6.6 7.1 6.6 6.5 6.5 6.4 6 6.3 ...
..$ unemploy: num [1:12] 7892 7865 7862 7542 7574 ...
..$ year : num [1:12] 1987 1987 1987 1987 1987 ...
$ 1988: tibble [12 × 7] (S3: tbl_df/tbl/data.frame)
..$ date : Date[1:12], format: "1988-01-01" "1988-02-01" ...
..$ pce : num [1:12] 3214 3221 3260 3263 3294 ...
..$ pop : num [1:12] 243981 244131 244279 244445 244610 ...
..$ psavert : num [1:12] 8.1 8.6 8.2 8.8 8.4 8.4 8.6 8.4 8.9 8.6 ...
..$ uempmed : num [1:12] 6.2 6.3 6.4 5.9 5.9 5.8 6.1 5.9 5.7 5.6 ...
..$ unemploy: num [1:12] 6953 6929 6876 6601 6779 ...
..$ year : num [1:12] 1988 1988 1988 1988 1988 ...
$ 1989: tibble [12 × 7] (S3: tbl_df/tbl/data.frame)
..$ date : Date[1:12], format: "1989-01-01" "1989-02-01" ...
..$ pce : num [1:12] 3484 3488 3499 3543 3552 ...
..$ pop : num [1:12] 246224 246378 246530 246721 246906 ...
..$ psavert : num [1:12] 8.5 9 9.5 8.4 8.1 8.2 8.2 7.6 8.1 8.5 ...
..$ uempmed : num [1:12] 5.6 5.4 5.4 5.4 5.3 5.4 5.6 5 4.9 4.9 ...
..$ unemploy: num [1:12] 6682 6359 6205 6468 6375 ...
..$ year : num [1:12] 1989 1989 1989 1989 1989 ...
$ 1990: tibble [12 × 7] (S3: tbl_df/tbl/data.frame)
..$ date : Date[1:12], format: "1990-01-01" "1990-02-01" ...
..$ pce : num [1:12] 3731 3728 3755 3770 3776 ...
..$ pop : num [1:12] 248659 248827 249012 249306 249565 ...
..$ psavert : num [1:12] 8 8.6 8.3 8.8 8.7 8.6 8.7 8.1 8.1 7.8 ...
..$ uempmed : num [1:12] 5.1 5.3 5.1 4.8 5.2 5.2 5.4 5.4 5.6 5.8 ...
..$ unemploy: num [1:12] 6752 6651 6598 6797 6742 ...
..$ year : num [1:12] 1990 1990 1990 1990 1990 1990 1990 1990 1990 1990 ...
$ 1991: tibble [12 × 7] (S3: tbl_df/tbl/data.frame)
..$ date : Date[1:12], format: "1991-01-01" "1991-02-01" ...
..$ pce : num [1:12] 3841 3867 3913 3907 3933 ...
..$ pop : num [1:12] 251889 252135 252372 252643 252913 ...
..$ psavert : num [1:12] 9.3 8.8 8 8.6 8.4 8.9 8.2 8.6 8.8 9.3 ...
..$ uempmed : num [1:12] 6 6.2 6.7 6.6 6.4 6.9 7 7.3 6.8 7.2 ...
..$ unemploy: num [1:12] 8015 8265 8586 8439 8736 ...
..$ year : num [1:12] 1991 1991 1991 1991 1991 ...
$ 1992: tibble [12 × 7] (S3: tbl_df/tbl/data.frame)
..$ date : Date[1:12], format: "1992-01-01" "1992-02-01" ...
..$ pce : num [1:12] 4085 4100 4117 4132 4158 ...
..$ pop : num [1:12] 255214 255448 255703 255992 256285 ...
..$ psavert : num [1:12] 9.4 9.8 9.7 9.9 9.9 10.1 9.6 9.7 8.7 8 ...
..$ uempmed : num [1:12] 8.1 8.2 8.3 8.5 8.8 8.7 8.6 8.8 8.6 9 ...
..$ unemploy: num [1:12] 9283 9454 9460 9415 9744 ...
..$ year : num [1:12] 1992 1992 1992 1992 1992 ...
$ 1993: tibble [12 × 7] (S3: tbl_df/tbl/data.frame)
..$ date : Date[1:12], format: "1993-01-01" "1993-02-01" ...
..$ pce : num [1:12] 4341 4355 4352 4393 4422 ...
..$ pop : num [1:12] 258679 258919 259152 259414 259680 ...
..$ psavert : num [1:12] 8.6 8.9 8.9 8.7 8.3 7.8 7.6 7.7 6.9 6.3 ...
..$ uempmed : num [1:12] 8.6 8.5 8.5 8.4 8.1 8.3 8.2 8.2 8.3 8 ...
..$ unemploy: num [1:12] 9325 9183 9056 9110 9149 ...
..$ year : num [1:12] 1993 1993 1993 1993 1993 ...
$ 1994: tibble [12 × 7] (S3: tbl_df/tbl/data.frame)
..$ date : Date[1:12], format: "1994-01-01" "1994-02-01" ...
..$ pce : num [1:12] 4585 4633 4646 4671 4670 ...
..$ pop : num [1:12] 261919 262123 262352 262631 262877 ...
..$ psavert : num [1:12] 7.1 6.5 6.8 6.4 7.6 6.9 7 6.5 6.8 7.1 ...
..$ uempmed : num [1:12] 8.6 9.2 9.3 9.1 9.2 9.3 9 8.9 9.2 10 ...
..$ unemploy: num [1:12] 8630 8583 8470 8331 7915 ...
..$ year : num [1:12] 1994 1994 1994 1994 1994 ...
$ 1995: tibble [12 × 7] (S3: tbl_df/tbl/data.frame)
..$ date : Date[1:12], format: "1995-01-01" "1995-02-01" ...
..$ pce : num [1:12] 4851 4851 4885 4890 4933 ...
..$ pop : num [1:12] 265044 265270 265495 265755 265998 ...
..$ psavert : num [1:12] 7.5 7.8 7.5 6.9 7.1 6.7 7.1 6.7 6.8 7.1 ...
..$ uempmed : num [1:12] 8 8.1 8.3 8.3 9.1 7.9 8.5 8.3 7.9 8.2 ...
..$ unemploy: num [1:12] 7375 7187 7153 7645 7430 ...
..$ year : num [1:12] 1995 1995 1995 1995 1995 ...
$ 1996: tibble [12 × 7] (S3: tbl_df/tbl/data.frame)
..$ date : Date[1:12], format: "1996-01-01" "1996-02-01" ...
..$ pce : num [1:12] 5086 5133 5173 5208 5224 ...
..$ pop : num [1:12] 268151 268364 268595 268853 269108 ...
..$ psavert : num [1:12] 6.7 6.7 6.6 5.7 6.7 7.1 6.7 6.6 6.7 6.4 ...
..$ uempmed : num [1:12] 8.3 7.8 8.3 8.6 8.6 8.3 8.3 8.4 8.5 8.3 ...
..$ unemploy: num [1:12] 7491 7313 7318 7415 7423 ...
..$ year : num [1:12] 1996 1996 1996 1996 1996 ...
$ 1997: tibble [12 × 7] (S3: tbl_df/tbl/data.frame)
..$ date : Date[1:12], format: "1997-01-01" "1997-02-01" ...
..$ pce : num [1:12] 5411 5434 5454 5459 5460 ...
..$ pop : num [1:12] 271360 271585 271821 272083 272342 ...
..$ psavert : num [1:12] 6.2 6.2 6.4 6.5 6.8 6.6 6.1 6 6.2 6.2 ...
..$ uempmed : num [1:12] 7.8 8.1 7.9 8.3 8 8 8.3 7.8 8.2 7.7 ...
..$ unemploy: num [1:12] 7158 7102 7000 6873 6655 ...
..$ year : num [1:12] 1997 1997 1997 1997 1997 ...
$ 1998: tibble [12 × 7] (S3: tbl_df/tbl/data.frame)
..$ date : Date[1:12], format: "1998-01-01" "1998-02-01" ...
..$ pce : num [1:12] 5690 5724 5750 5788 5838 ...
..$ pop : num [1:12] 274626 274838 275047 275304 275564 ...
..$ psavert : num [1:12] 7.4 7.4 7.5 7.2 6.9 6.8 6.9 6.8 6.4 6.2 ...
..$ uempmed : num [1:12] 7.4 7 6.8 6.7 6 6.9 6.7 6.8 6.7 5.8 ...
..$ unemploy: num [1:12] 6368 6306 6422 5941 6047 ...
..$ year : num [1:12] 1998 1998 1998 1998 1998 ...
$ 1999: tibble [12 × 7] (S3: tbl_df/tbl/data.frame)
..$ date : Date[1:12], format: "1999-01-01" "1999-02-01" ...
..$ pce : num [1:12] 6073 6102 6133 6196 6226 ...
..$ pop : num [1:12] 277790 277992 278198 278451 278717 ...
..$ psavert : num [1:12] 6.4 6.2 5.9 5.2 4.9 4.8 4.8 4.7 4.2 4.6 ...
..$ uempmed : num [1:12] 6.9 6.8 6.8 6.2 6.5 6.3 5.8 6.5 6 6.1 ...
..$ unemploy: num [1:12] 5976 6111 5783 6004 5796 ...
..$ year : num [1:12] 1999 1999 1999 1999 1999 ...
$ 2000: tibble [12 × 7] (S3: tbl_df/tbl/data.frame)
..$ date : Date[1:12], format: "2000-01-01" "2000-02-01" ...
..$ pce : num [1:12] 6535 6620 6686 6671 6708 ...
..$ pop : num [1:12] 280976 281190 281409 281653 281877 ...
..$ psavert : num [1:12] 5.4 4.8 4.5 5 4.9 4.9 5.2 5.2 4.5 4.6 ...
..$ uempmed : num [1:12] 5.8 6.1 6 6.1 5.8 5.7 6 6.3 5.2 6.1 ...
..$ unemploy: num [1:12] 5708 5858 5733 5481 5758 ...
..$ year : num [1:12] 2000 2000 2000 2000 2000 2000 2000 2000 2000 2000 ...
$ 2001: tibble [12 × 7] (S3: tbl_df/tbl/data.frame)
..$ date : Date[1:12], format: "2001-01-01" "2001-02-01" ...
..$ pce : num [1:12] 6977 6996 6988 7001 7047 ...
..$ pop : num [1:12] 283920 284137 284350 284581 284810 ...
..$ psavert : num [1:12] 4.8 4.9 5.3 5 4.5 4.5 5.6 6.8 7 3.4 ...
..$ uempmed : num [1:12] 5.8 6.1 6.6 5.9 6.3 6 6.8 6.9 7.2 7.3 ...
..$ unemploy: num [1:12] 6023 6089 6141 6271 6226 ...
..$ year : num [1:12] 2001 2001 2001 2001 2001 ...
$ 2002: tibble [12 × 7] (S3: tbl_df/tbl/data.frame)
..$ date : Date[1:12], format: "2002-01-01" "2002-02-01" ...
..$ pce : num [1:12] 7174 7218 7237 7305 7283 ...
..$ pop : num [1:12] 286788 286994 287190 287397 287623 ...
..$ psavert : num [1:12] 6.1 5.8 5.9 5.8 6.5 6.4 5.5 5.4 5.7 5.7 ...
..$ uempmed : num [1:12] 8.4 8.3 8.4 8.9 9.5 11 8.9 9 9.5 9.6 ...
..$ unemploy: num [1:12] 8182 8215 8304 8599 8399 ...
..$ year : num [1:12] 2002 2002 2002 2002 2002 ...
$ 2003: tibble [12 × 7] (S3: tbl_df/tbl/data.frame)
..$ date : Date[1:12], format: "2003-01-01" "2003-02-01" ...
..$ pce : num [1:12] 7533 7536 7598 7621 7628 ...
..$ pop : num [1:12] 289518 289714 289911 290125 290346 ...
..$ psavert : num [1:12] 5.5 5.6 5.3 5.3 5.8 5.6 6.3 6 5.2 5.3 ...
..$ uempmed : num [1:12] 9.6 9.5 9.7 10.2 9.9 11.5 10.3 10.1 10.2 10.4 ...
..$ unemploy: num [1:12] 8520 8618 8588 8842 8957 ...
..$ year : num [1:12] 2003 2003 2003 2003 2003 ...
$ 2004: tibble [12 × 7] (S3: tbl_df/tbl/data.frame)
..$ date : Date[1:12], format: "2004-01-01" "2004-02-01" ...
..$ pce : num [1:12] 7987 8020 8076 8089 8163 ...
..$ pop : num [1:12] 292192 292368 292561 292779 292997 ...
..$ psavert : num [1:12] 5 5 4.9 5.3 5.3 5.8 5.3 5.2 4.6 4.5 ...
..$ uempmed : num [1:12] 10.6 10.2 10.2 9.5 9.9 11 8.9 9.2 9.6 9.5 ...
..$ unemploy: num [1:12] 8370 8167 8491 8170 8212 ...
..$ year : num [1:12] 2004 2004 2004 2004 2004 ...
$ 2005: tibble [12 × 7] (S3: tbl_df/tbl/data.frame)
..$ date : Date[1:12], format: "2005-01-01" "2005-02-01" ...
..$ pce : num [1:12] 8470 8529 8570 8646 8644 ...
..$ pop : num [1:12] 294914 295105 295287 295490 295704 ...
..$ psavert : num [1:12] 3.7 3.4 3.6 3.1 3.5 2.9 2.2 2.7 2.7 3.1 ...
..$ uempmed : num [1:12] 9.4 9.2 9.3 9 9.1 9 8.8 9.2 8.4 8.6 ...
..$ unemploy: num [1:12] 7784 7980 7737 7672 7651 ...
..$ year : num [1:12] 2005 2005 2005 2005 2005 ...
$ 2006: tibble [12 × 7] (S3: tbl_df/tbl/data.frame)
..$ date : Date[1:12], format: "2006-01-01" "2006-02-01" ...
..$ pce : num [1:12] 9060 9090 9122 9175 9215 ...
..$ pop : num [1:12] 297647 297854 298060 298281 298496 ...
..$ psavert : num [1:12] 4.2 4.2 4.2 4 3.8 4 3.4 3.6 3.6 3.6 ...
..$ uempmed : num [1:12] 8.6 9.1 8.7 8.4 8.5 7.3 8 8.4 8 7.9 ...
..$ unemploy: num [1:12] 7064 7184 7072 7120 6980 ...
..$ year : num [1:12] 2006 2006 2006 2006 2006 ...
$ 2007: tibble [12 × 7] (S3: tbl_df/tbl/data.frame)
..$ date : Date[1:12], format: "2007-01-01" "2007-02-01" ...
..$ pce : num [1:12] 9516 9547 9585 9616 9651 ...
..$ pop : num [1:12] 300574 300802 301021 301254 301483 ...
..$ psavert : num [1:12] 3.7 4.1 4.4 4.2 4 3.8 3.7 3.4 3.5 3.4 ...
..$ uempmed : num [1:12] 8.3 8.5 9.1 8.6 8.2 7.7 8.7 8.8 8.7 8.4 ...
..$ unemploy: num [1:12] 7116 6927 6731 6850 6766 ...
..$ year : num [1:12] 2007 2007 2007 2007 2007 ...
$ 2008: tibble [12 × 7] (S3: tbl_df/tbl/data.frame)
..$ date : Date[1:12], format: "2008-01-01" "2008-02-01" ...
..$ pce : num [1:12] 9930 9913 9959 9997 10054 ...
..$ pop : num [1:12] 303506 303711 303907 304117 304323 ...
..$ psavert : num [1:12] 3.7 4.1 4 3.4 7.8 5.5 4.4 3.8 4.7 5.5 ...
..$ uempmed : num [1:12] 9 8.7 8.7 9.4 7.9 9 9.7 9.7 10.2 10.4 ...
..$ unemploy: num [1:12] 7685 7497 7822 7637 8395 ...
..$ year : num [1:12] 2008 2008 2008 2008 2008 ...
$ 2009: tibble [12 × 7] (S3: tbl_df/tbl/data.frame)
..$ date : Date[1:12], format: "2009-01-01" "2009-02-01" ...
..$ pce : num [1:12] 9784 9766 9718 9725 9749 ...
..$ pop : num [1:12] 306208 306402 306588 306787 306984 ...
..$ psavert : num [1:12] 6.2 5.5 5.9 6.8 8.2 6.7 6 4.9 5.9 5.4 ...
..$ uempmed : num [1:12] 10.7 11.7 12.3 13.1 14.2 17.2 16 16.3 17.8 18.9 ...
..$ unemploy: num [1:12] 12058 12898 13426 13853 14499 ...
..$ year : num [1:12] 2009 2009 2009 2009 2009 ...
$ 2010: tibble [12 × 7] (S3: tbl_df/tbl/data.frame)
..$ date : Date[1:12], format: "2010-01-01" "2010-02-01" ...
..$ pce : num [1:12] 10002 10031 10089 10113 10131 ...
..$ pop : num [1:12] 308833 309027 309212 309191 309369 ...
..$ psavert : num [1:12] 6.1 5.8 5.7 6.4 7 6.9 6.8 6.9 6.7 6.6 ...
..$ uempmed : num [1:12] 20 19.9 20.4 22.1 22.3 25.2 22.3 21 20.3 21.2 ...
..$ unemploy: num [1:12] 15046 15113 15202 15325 14849 ...
..$ year : num [1:12] 2010 2010 2010 2010 2010 2010 2010 2010 2010 2010 ...
$ 2011: tibble [12 × 7] (S3: tbl_df/tbl/data.frame)
..$ date : Date[1:12], format: "2011-01-01" "2011-02-01" ...
..$ pce : num [1:12] 10436 10470 10550 10588 10612 ...
..$ pop : num [1:12] 310961 311113 311265 311436 311607 ...
..$ psavert : num [1:12] 7.4 7.6 7 6.9 6.9 7.2 7.3 7.2 6.8 6.8 ...
..$ uempmed : num [1:12] 21.5 21.1 21.5 20.9 21.6 22.4 22 22.4 22 20.6 ...
..$ unemploy: num [1:12] 14013 13820 13737 13957 13855 ...
..$ year : num [1:12] 2011 2011 2011 2011 2011 ...
$ 2012: tibble [12 × 7] (S3: tbl_df/tbl/data.frame)
..$ date : Date[1:12], format: "2012-01-01" "2012-02-01" ...
..$ pce : num [1:12] 10862 10954 10952 10980 10969 ...
..$ pop : num [1:12] 313183 313339 313499 313667 313831 ...
..$ psavert : num [1:12] 8 8 8.5 8.7 8.8 9.1 8.2 8 8.2 8.8 ...
..$ uempmed : num [1:12] 20.8 19.7 19.2 19.1 19.9 20.4 17.5 18.4 18.8 19.9 ...
..$ unemploy: num [1:12] 12797 12813 12713 12646 12660 ...
..$ year : num [1:12] 2012 2012 2012 2012 2012 ...
$ 2013: tibble [12 × 7] (S3: tbl_df/tbl/data.frame)
..$ date : Date[1:12], format: "2013-01-01" "2013-02-01" ...
..$ pce : num [1:12] 11203 11240 11227 11205 11245 ...
..$ pop : num [1:12] 315390 315520 315662 315818 315984 ...
..$ psavert : num [1:12] 6.3 5.8 5.9 6.4 6.7 6.8 6.6 6.7 6.8 6.3 ...
..$ uempmed : num [1:12] 15.8 17.2 17.6 17.1 17.1 17 16.2 16.5 16.5 16.3 ...
..$ unemploy: num [1:12] 12471 11950 11689 11760 11654 ...
..$ year : num [1:12] 2013 2013 2013 2013 2013 ...
$ 2014: tibble [12 × 7] (S3: tbl_df/tbl/data.frame)
..$ date : Date[1:12], format: "2014-01-01" "2014-02-01" ...
..$ pce : num [1:12] 11512 11566 11643 11703 11748 ...
..$ pop : num [1:12] 317594 317754 317917 318089 318270 ...
..$ psavert : num [1:12] 7.1 7.3 7.4 7.4 7.4 7.4 7.5 7.2 7.4 7.2 ...
..$ uempmed : num [1:12] 15.4 15.9 15.8 15.7 14.6 13.8 13.1 12.9 13.4 13.6 ...
..$ unemploy: num [1:12] 10202 10349 10380 9702 9859 ...
..$ year : num [1:12] 2014 2014 2014 2014 2014 ...
$ 2015: tibble [4 × 7] (S3: tbl_df/tbl/data.frame)
..$ date : Date[1:4], format: "2015-01-01" "2015-02-01" ...
..$ pce : num [1:4] 12046 12082 12158 12194
..$ pop : num [1:4] 319929 320075 320231 320402
..$ psavert : num [1:4] 7.7 7.9 7.4 7.6
..$ uempmed : num [1:4] 13.2 12.9 12 11.5
..$ unemploy: num [1:4] 8903 8610 8504 8526
..$ year : num [1:4] 2015 2015 2015 2015Model
What is the relation between personal consumption expenditures (pce) and the unemployment percentage over time?
. . .
Problem: We don’t have the percentage. Let’s compute!
You try first!
. . .
by_year <- map(by_year,
               ~mutate(.x, percent = unemploy / pop))
str(by_year)
List of 49
$ 1967: tibble [6 × 8] (S3: tbl_df/tbl/data.frame)
..$ date : Date[1:6], format: "1967-07-01" "1967-08-01" ...
..$ pce : num [1:6] 507 510 516 512 517 ...
..$ pop : num [1:6] 198712 198911 199113 199311 199498 ...
..$ psavert : num [1:6] 12.6 12.6 11.9 12.9 12.8 11.8
..$ uempmed : num [1:6] 4.5 4.7 4.6 4.9 4.7 4.8
..$ unemploy: num [1:6] 2944 2945 2958 3143 3066 ...
..$ year : num [1:6] 1967 1967 1967 1967 1967 ...
..$ percent : num [1:6] 0.0148 0.0148 0.0149 0.0158 0.0154 ...
$ 1968: tibble [12 × 8] (S3: tbl_df/tbl/data.frame)
..$ date : Date[1:12], format: "1968-01-01" "1968-02-01" ...
..$ pce : num [1:12] 531 534 544 544 550 ...
..$ pop : num [1:12] 2e+05 2e+05 2e+05 2e+05 2e+05 ...
..$ psavert : num [1:12] 11.7 12.3 11.7 12.3 12 11.7 10.7 10.5 10.6 10.8 ...
..$ uempmed : num [1:12] 5.1 4.5 4.1 4.6 4.4 4.4 4.5 4.2 4.6 4.8 ...
..$ unemploy: num [1:12] 2878 3001 2877 2709 2740 ...
..$ year : num [1:12] 1968 1968 1968 1968 1968 ...
..$ percent : num [1:12] 0.0144 0.015 0.0144 0.0135 0.0137 ...
$ 1969: tibble [12 × 8] (S3: tbl_df/tbl/data.frame)
..$ date : Date[1:12], format: "1969-01-01" "1969-02-01" ...
..$ pce : num [1:12] 584 589 589 594 600 ...
..$ pop : num [1:12] 201760 201881 202023 202161 202331 ...
..$ psavert : num [1:12] 10.3 9.7 10.2 9.7 10.1 11.1 11.8 11.5 11.6 11.4 ...
..$ uempmed : num [1:12] 4.4 4.9 4 4 4.2 4.4 4.4 4.4 4.7 4.5 ...
..$ unemploy: num [1:12] 2718 2692 2712 2758 2713 ...
..$ year : num [1:12] 1969 1969 1969 1969 1969 ...
..$ percent : num [1:12] 0.0135 0.0133 0.0134 0.0136 0.0134 ...
$ 1970: tibble [12 × 8] (S3: tbl_df/tbl/data.frame)
..$ date : Date[1:12], format: "1970-01-01" "1970-02-01" ...
..$ pce : num [1:12] 629 634 632 636 642 ...
..$ pop : num [1:12] 203849 204008 204156 204401 204607 ...
..$ psavert : num [1:12] 11.8 11.7 12.4 13.3 12.4 12.3 13.5 13.4 12.9 13.1 ...
..$ uempmed : num [1:12] 4.6 4.5 4.6 4.1 4.7 4.9 5.1 5.4 5.2 5.2 ...
..$ unemploy: num [1:12] 3201 3453 3635 3797 3919 ...
..$ year : num [1:12] 1970 1970 1970 1970 1970 1970 1970 1970 1970 1970 ...
..$ percent : num [1:12] 0.0157 0.0169 0.0178 0.0186 0.0192 ...
$ 1971: tibble [12 × 8] (S3: tbl_df/tbl/data.frame)
..$ date : Date[1:12], format: "1971-01-01" "1971-02-01" ...
..$ pce : num [1:12] 676 679 682 689 691 ...
..$ pop : num [1:12] 206466 206668 206855 207065 207260 ...
..$ psavert : num [1:12] 13.3 13.3 13.5 13.2 13.6 14.7 13.8 13.6 13.3 13.3 ...
..$ uempmed : num [1:12] 6.2 6.3 6.4 6.5 6.7 5.7 6.2 6.4 5.8 6.5 ...
..$ unemploy: num [1:12] 4986 4903 4987 4959 4996 ...
..$ year : num [1:12] 1971 1971 1971 1971 1971 ...
..$ percent : num [1:12] 0.0241 0.0237 0.0241 0.0239 0.0241 ...
$ 1972: tibble [12 × 8] (S3: tbl_df/tbl/data.frame)
..$ date : Date[1:12], format: "1972-01-01" "1972-02-01" ...
..$ pce : num [1:12] 732 736 749 752 758 ...
..$ pop : num [1:12] 208917 209061 209212 209386 209545 ...
..$ psavert : num [1:12] 12.5 12.8 11.8 11.5 11.7 11.7 11.7 12 12.2 13 ...
..$ uempmed : num [1:12] 6.2 6.6 6.6 6.7 6.6 5.4 6.1 6 5.6 5.7 ...
..$ unemploy: num [1:12] 5019 4928 5038 4959 4922 ...
..$ year : num [1:12] 1972 1972 1972 1972 1972 ...
..$ percent : num [1:12] 0.024 0.0236 0.0241 0.0237 0.0235 ...
$ 1973: tibble [12 × 8] (S3: tbl_df/tbl/data.frame)
..$ date : Date[1:12], format: "1973-01-01" "1973-02-01" ...
..$ pce : num [1:12] 816 826 833 836 842 ...
..$ pop : num [1:12] 210985 211120 211254 211420 211577 ...
..$ psavert : num [1:12] 12.4 12.5 12.7 13.2 13.2 13.6 13.2 13.9 13.1 14.4 ...
..$ uempmed : num [1:12] 5.7 5.2 5.5 5 4.9 5 5.2 4.9 5.4 5.5 ...
..$ unemploy: num [1:12] 4326 4452 4394 4459 4329 ...
..$ year : num [1:12] 1973 1973 1973 1973 1973 ...
..$ percent : num [1:12] 0.0205 0.0211 0.0208 0.0211 0.0205 ...
$ 1974: tibble [12 × 8] (S3: tbl_df/tbl/data.frame)
..$ date : Date[1:12], format: "1974-01-01" "1974-02-01" ...
..$ pce : num [1:12] 884 890 901 911 922 ...
..$ pop : num [1:12] 212932 213074 213211 213361 213513 ...
..$ psavert : num [1:12] 14.3 14.2 13.4 13.1 12.8 12.8 12.8 12.1 12.9 13.4 ...
..$ uempmed : num [1:12] 5 5.1 4.8 5 4.6 5.3 5.7 5 5.3 5.5 ...
..$ unemploy: num [1:12] 4644 4731 4634 4618 4705 ...
..$ year : num [1:12] 1974 1974 1974 1974 1974 ...
..$ percent : num [1:12] 0.0218 0.0222 0.0217 0.0216 0.022 ...
$ 1975: tibble [12 × 8] (S3: tbl_df/tbl/data.frame)
..$ date : Date[1:12], format: "1975-01-01" "1975-02-01" ...
..$ pce : num [1:12] 976 989 991 995 1019 ...
..$ pop : num [1:12] 214931 215065 215198 215353 215523 ...
..$ psavert : num [1:12] 13.2 12.5 12.7 14.2 17.3 14.3 12.6 13 13 13.4 ...
..$ uempmed : num [1:12] 6.3 7.1 7.2 8.7 9.4 8.8 8.6 9.2 9.2 8.6 ...
..$ unemploy: num [1:12] 7501 7520 7978 8210 8433 ...
..$ year : num [1:12] 1975 1975 1975 1975 1975 ...
..$ percent : num [1:12] 0.0349 0.035 0.0371 0.0381 0.0391 ...
$ 1976: tibble [12 × 8] (S3: tbl_df/tbl/data.frame)
..$ date : Date[1:12], format: "1976-01-01" "1976-02-01" ...
..$ pce : num [1:12] 1107 1108 1115 1125 1123 ...
..$ pop : num [1:12] 217095 217249 217381 217528 217685 ...
..$ psavert : num [1:12] 11.7 12.3 12.2 11.7 12.3 11.4 11.7 11.7 11.4 11.1 ...
..$ uempmed : num [1:12] 9 8.2 8.7 8.2 8.3 7.8 7.7 7.9 7.8 7.7 ...
..$ unemploy: num [1:12] 7534 7326 7230 7330 7053 ...
..$ year : num [1:12] 1976 1976 1976 1976 1976 ...
..$ percent : num [1:12] 0.0347 0.0337 0.0333 0.0337 0.0324 ...
$ 1977: tibble [12 × 8] (S3: tbl_df/tbl/data.frame)
..$ date : Date[1:12], format: "1977-01-01" "1977-02-01" ...
..$ pce : num [1:12] 1215 1231 1238 1247 1257 ...
..$ pop : num [1:12] 219179 219344 219504 219684 219859 ...
..$ psavert : num [1:12] 10.6 9.3 10.5 10.5 10.3 10.6 10.5 10.9 11.1 11 ...
..$ uempmed : num [1:12] 7.5 7.2 7.2 7.3 7.9 6.2 7.1 7 6.7 6.9 ...
..$ unemploy: num [1:12] 7280 7443 7307 7059 6911 ...
..$ year : num [1:12] 1977 1977 1977 1977 1977 ...
..$ percent : num [1:12] 0.0332 0.0339 0.0333 0.0321 0.0314 ...
$ 1978: tibble [12 × 8] (S3: tbl_df/tbl/data.frame)
..$ date : Date[1:12], format: "1978-01-01" "1978-02-01" ...
..$ pce : num [1:12] 1330 1355 1378 1396 1412 ...
..$ pop : num [1:12] 221477 221629 221792 221991 222176 ...
..$ psavert : num [1:12] 11.9 11.1 11 10.8 10.3 10 10.9 10.5 10.6 10.7 ...
..$ uempmed : num [1:12] 6.5 6.7 6.2 6.1 5.7 6 5.8 5.8 5.6 5.9 ...
..$ unemploy: num [1:12] 6489 6318 6337 6180 6127 ...
..$ year : num [1:12] 1978 1978 1978 1978 1978 ...
..$ percent : num [1:12] 0.0293 0.0285 0.0286 0.0278 0.0276 ...
$ 1979: tibble [12 × 8] (S3: tbl_df/tbl/data.frame)
..$ date : Date[1:12], format: "1979-01-01" "1979-02-01" ...
..$ pce : num [1:12] 1502 1518 1531 1538 1559 ...
..$ pop : num [1:12] 223865 224053 224235 224438 224632 ...
..$ psavert : num [1:12] 11.1 11.1 11.2 11 10.3 9.9 10.6 9.7 9.4 9.7 ...
..$ uempmed : num [1:12] 5.9 5.9 5.9 5.4 5.6 5.6 5.9 4.8 5.5 5.5 ...
..$ unemploy: num [1:12] 6109 6173 6109 6069 5840 ...
..$ year : num [1:12] 1979 1979 1979 1979 1979 ...
..$ percent : num [1:12] 0.0273 0.0276 0.0272 0.027 0.026 ...
$ 1980: tibble [12 × 8] (S3: tbl_df/tbl/data.frame)
..$ date : Date[1:12], format: "1980-01-01" "1980-02-01" ...
..$ pce : num [1:12] 1697 1701 1708 1695 1700 ...
..$ pop : num [1:12] 226451 226656 226849 227061 227251 ...
..$ psavert : num [1:12] 9.9 10.1 10.2 11.3 11.4 11.2 11.3 11.3 11.7 11.3 ...
..$ uempmed : num [1:12] 5.3 5.8 6 5.8 5.7 6.4 7 7.5 7.7 7.5 ...
..$ unemploy: num [1:12] 6683 6702 6729 7358 7984 ...
..$ year : num [1:12] 1980 1980 1980 1980 1980 1980 1980 1980 1980 1980 ...
..$ percent : num [1:12] 0.0295 0.0296 0.0297 0.0324 0.0351 ...
$ 1981: tibble [12 × 8] (S3: tbl_df/tbl/data.frame)
..$ date : Date[1:12], format: "1981-01-01" "1981-02-01" ...
..$ pce : num [1:12] 1870 1884 1903 1904 1914 ...
..$ pop : num [1:12] 228937 229071 229224 229403 229575 ...
..$ psavert : num [1:12] 10.9 10.8 10.8 10.9 11 10.8 12.3 12 12.4 13 ...
..$ uempmed : num [1:12] 7.4 7.1 7.1 7.4 6.9 6.6 7.1 7.2 6.8 6.8 ...
..$ unemploy: num [1:12] 8071 8051 7982 7869 8174 ...
..$ year : num [1:12] 1981 1981 1981 1981 1981 ...
..$ percent : num [1:12] 0.0353 0.0351 0.0348 0.0343 0.0356 ...
$ 1982: tibble [12 × 8] (S3: tbl_df/tbl/data.frame)
..$ date : Date[1:12], format: "1982-01-01" "1982-02-01" ...
..$ pce : num [1:12] 1997 2021 2024 2026 2044 ...
..$ pop : num [1:12] 231157 231313 231470 231645 231809 ...
..$ psavert : num [1:12] 12.7 12.1 12.2 12.9 12.3 12.3 12.5 12.6 11.8 11.3 ...
..$ uempmed : num [1:12] 7.1 7.5 7.7 8.1 8.5 9.5 8.5 8.7 9.5 9.7 ...
..$ unemploy: num [1:12] 9397 9705 9895 10244 10335 ...
..$ year : num [1:12] 1982 1982 1982 1982 1982 ...
..$ percent : num [1:12] 0.0407 0.042 0.0427 0.0442 0.0446 ...
$ 1983: tibble [12 × 8] (S3: tbl_df/tbl/data.frame)
..$ date : Date[1:12], format: "1983-01-01" "1983-02-01" ...
..$ pce : num [1:12] 2174 2177 2203 2226 2246 ...
..$ pop : num [1:12] 233322 233473 233613 233781 233922 ...
..$ psavert : num [1:12] 11.1 11.1 10.6 10.3 9.9 9.1 9.6 9.2 9.6 9.7 ...
..$ uempmed : num [1:12] 11.1 9.8 10.4 10.9 12.3 11.3 10.1 9.3 9.3 9.4 ...
..$ unemploy: num [1:12] 11534 11545 11408 11268 11154 ...
..$ year : num [1:12] 1983 1983 1983 1983 1983 ...
..$ percent : num [1:12] 0.0494 0.0494 0.0488 0.0482 0.0477 ...
$ 1984: tibble [12 × 8] (S3: tbl_df/tbl/data.frame)
..$ date : Date[1:12], format: "1984-01-01" "1984-02-01" ...
..$ pce : num [1:12] 2419 2404 2432 2458 2474 ...
..$ pop : num [1:12] 235385 235527 235675 235839 235993 ...
..$ psavert : num [1:12] 10 11.7 11.5 11.5 11.1 11.1 11.6 11.8 11.8 11.7 ...
..$ uempmed : num [1:12] 9.1 8.3 8.3 8.2 9.1 7.5 7.5 7.3 7.6 7.2 ...
..$ unemploy: num [1:12] 9008 8791 8746 8762 8456 ...
..$ year : num [1:12] 1984 1984 1984 1984 1984 ...
..$ percent : num [1:12] 0.0383 0.0373 0.0371 0.0372 0.0358 ...
$ 1985: tibble [12 × 8] (S3: tbl_df/tbl/data.frame)
..$ date : Date[1:12], format: "1985-01-01" "1985-02-01" ...
..$ pce : num [1:12] 2619 2641 2648 2660 2696 ...
..$ pop : num [1:12] 237468 237602 237732 237900 238074 ...
..$ psavert : num [1:12] 10.3 9.1 8.7 9.9 11.1 9.6 9.1 8.2 7.3 9.1 ...
..$ uempmed : num [1:12] 6.8 7.1 7.1 6.9 6.9 6.6 6.9 7.1 6.9 7.1 ...
..$ unemploy: num [1:12] 8423 8321 8339 8395 8302 ...
..$ year : num [1:12] 1985 1985 1985 1985 1985 ...
..$ percent : num [1:12] 0.0355 0.035 0.0351 0.0353 0.0349 ...
$ 1986: tibble [12 × 8] (S3: tbl_df/tbl/data.frame)
..$ date : Date[1:12], format: "1986-01-01" "1986-02-01" ...
..$ pce : num [1:12] 2827 2820 2824 2835 2858 ...
..$ pop : num [1:12] 239638 239788 239928 240094 240271 ...
..$ psavert : num [1:12] 8.6 9.3 9.9 9.7 9.3 9.4 9.3 9 7.2 8.4 ...
..$ uempmed : num [1:12] 6.7 6.9 6.8 6.7 6.8 7 6.9 7.1 7.4 7 ...
..$ unemploy: num [1:12] 7795 8402 8383 8364 8439 ...
..$ year : num [1:12] 1986 1986 1986 1986 1986 ...
..$ percent : num [1:12] 0.0325 0.035 0.0349 0.0348 0.0351 ...
$ 1987: tibble [12 × 8] (S3: tbl_df/tbl/data.frame)
..$ date : Date[1:12], format: "1987-01-01" "1987-02-01" ...
..$ pce : num [1:12] 2936 3002 3013 3039 3048 ...
..$ pop : num [1:12] 241784 241930 242079 242252 242423 ...
..$ psavert : num [1:12] 9.7 8.5 8.5 4.5 8.2 7.7 7.5 7.2 7.6 8.3 ...
..$ uempmed : num [1:12] 6.9 6.6 6.6 7.1 6.6 6.5 6.5 6.4 6 6.3 ...
..$ unemploy: num [1:12] 7892 7865 7862 7542 7574 ...
..$ year : num [1:12] 1987 1987 1987 1987 1987 ...
..$ percent : num [1:12] 0.0326 0.0325 0.0325 0.0311 0.0312 ...
$ 1988: tibble [12 × 8] (S3: tbl_df/tbl/data.frame)
..$ date : Date[1:12], format: "1988-01-01" "1988-02-01" ...
..$ pce : num [1:12] 3214 3221 3260 3263 3294 ...
..$ pop : num [1:12] 243981 244131 244279 244445 244610 ...
..$ psavert : num [1:12] 8.1 8.6 8.2 8.8 8.4 8.4 8.6 8.4 8.9 8.6 ...
..$ uempmed : num [1:12] 6.2 6.3 6.4 5.9 5.9 5.8 6.1 5.9 5.7 5.6 ...
..$ unemploy: num [1:12] 6953 6929 6876 6601 6779 ...
..$ year : num [1:12] 1988 1988 1988 1988 1988 ...
..$ percent : num [1:12] 0.0285 0.0284 0.0281 0.027 0.0277 ...
$ 1989: tibble [12 × 8] (S3: tbl_df/tbl/data.frame)
..$ date : Date[1:12], format: "1989-01-01" "1989-02-01" ...
..$ pce : num [1:12] 3484 3488 3499 3543 3552 ...
..$ pop : num [1:12] 246224 246378 246530 246721 246906 ...
..$ psavert : num [1:12] 8.5 9 9.5 8.4 8.1 8.2 8.2 7.6 8.1 8.5 ...
..$ uempmed : num [1:12] 5.6 5.4 5.4 5.4 5.3 5.4 5.6 5 4.9 4.9 ...
..$ unemploy: num [1:12] 6682 6359 6205 6468 6375 ...
..$ year : num [1:12] 1989 1989 1989 1989 1989 ...
..$ percent : num [1:12] 0.0271 0.0258 0.0252 0.0262 0.0258 ...
$ 1990: tibble [12 × 8] (S3: tbl_df/tbl/data.frame)
..$ date : Date[1:12], format: "1990-01-01" "1990-02-01" ...
..$ pce : num [1:12] 3731 3728 3755 3770 3776 ...
..$ pop : num [1:12] 248659 248827 249012 249306 249565 ...
..$ psavert : num [1:12] 8 8.6 8.3 8.8 8.7 8.6 8.7 8.1 8.1 7.8 ...
..$ uempmed : num [1:12] 5.1 5.3 5.1 4.8 5.2 5.2 5.4 5.4 5.6 5.8 ...
..$ unemploy: num [1:12] 6752 6651 6598 6797 6742 ...
..$ year : num [1:12] 1990 1990 1990 1990 1990 1990 1990 1990 1990 1990 ...
..$ percent : num [1:12] 0.0272 0.0267 0.0265 0.0273 0.027 ...
$ 1991: tibble [12 × 8] (S3: tbl_df/tbl/data.frame)
..$ date : Date[1:12], format: "1991-01-01" "1991-02-01" ...
..$ pce : num [1:12] 3841 3867 3913 3907 3933 ...
..$ pop : num [1:12] 251889 252135 252372 252643 252913 ...
..$ psavert : num [1:12] 9.3 8.8 8 8.6 8.4 8.9 8.2 8.6 8.8 9.3 ...
..$ uempmed : num [1:12] 6 6.2 6.7 6.6 6.4 6.9 7 7.3 6.8 7.2 ...
..$ unemploy: num [1:12] 8015 8265 8586 8439 8736 ...
..$ year : num [1:12] 1991 1991 1991 1991 1991 ...
..$ percent : num [1:12] 0.0318 0.0328 0.034 0.0334 0.0345 ...
$ 1992: tibble [12 × 8] (S3: tbl_df/tbl/data.frame)
..$ date : Date[1:12], format: "1992-01-01" "1992-02-01" ...
..$ pce : num [1:12] 4085 4100 4117 4132 4158 ...
..$ pop : num [1:12] 255214 255448 255703 255992 256285 ...
..$ psavert : num [1:12] 9.4 9.8 9.7 9.9 9.9 10.1 9.6 9.7 8.7 8 ...
..$ uempmed : num [1:12] 8.1 8.2 8.3 8.5 8.8 8.7 8.6 8.8 8.6 9 ...
..$ unemploy: num [1:12] 9283 9454 9460 9415 9744 ...
..$ year : num [1:12] 1992 1992 1992 1992 1992 ...
..$ percent : num [1:12] 0.0364 0.037 0.037 0.0368 0.038 ...
$ 1993: tibble [12 × 8] (S3: tbl_df/tbl/data.frame)
..$ date : Date[1:12], format: "1993-01-01" "1993-02-01" ...
..$ pce : num [1:12] 4341 4355 4352 4393 4422 ...
..$ pop : num [1:12] 258679 258919 259152 259414 259680 ...
..$ psavert : num [1:12] 8.6 8.9 8.9 8.7 8.3 7.8 7.6 7.7 6.9 6.3 ...
..$ uempmed : num [1:12] 8.6 8.5 8.5 8.4 8.1 8.3 8.2 8.2 8.3 8 ...
..$ unemploy: num [1:12] 9325 9183 9056 9110 9149 ...
..$ year : num [1:12] 1993 1993 1993 1993 1993 ...
..$ percent : num [1:12] 0.036 0.0355 0.0349 0.0351 0.0352 ...
$ 1994: tibble [12 × 8] (S3: tbl_df/tbl/data.frame)
..$ date : Date[1:12], format: "1994-01-01" "1994-02-01" ...
..$ pce : num [1:12] 4585 4633 4646 4671 4670 ...
..$ pop : num [1:12] 261919 262123 262352 262631 262877 ...
..$ psavert : num [1:12] 7.1 6.5 6.8 6.4 7.6 6.9 7 6.5 6.8 7.1 ...
..$ uempmed : num [1:12] 8.6 9.2 9.3 9.1 9.2 9.3 9 8.9 9.2 10 ...
..$ unemploy: num [1:12] 8630 8583 8470 8331 7915 ...
..$ year : num [1:12] 1994 1994 1994 1994 1994 ...
..$ percent : num [1:12] 0.0329 0.0327 0.0323 0.0317 0.0301 ...
$ 1995: tibble [12 × 8] (S3: tbl_df/tbl/data.frame)
..$ date : Date[1:12], format: "1995-01-01" "1995-02-01" ...
..$ pce : num [1:12] 4851 4851 4885 4890 4933 ...
..$ pop : num [1:12] 265044 265270 265495 265755 265998 ...
..$ psavert : num [1:12] 7.5 7.8 7.5 6.9 7.1 6.7 7.1 6.7 6.8 7.1 ...
..$ uempmed : num [1:12] 8 8.1 8.3 8.3 9.1 7.9 8.5 8.3 7.9 8.2 ...
..$ unemploy: num [1:12] 7375 7187 7153 7645 7430 ...
..$ year : num [1:12] 1995 1995 1995 1995 1995 ...
..$ percent : num [1:12] 0.0278 0.0271 0.0269 0.0288 0.0279 ...
$ 1996: tibble [12 × 8] (S3: tbl_df/tbl/data.frame)
..$ date : Date[1:12], format: "1996-01-01" "1996-02-01" ...
..$ pce : num [1:12] 5086 5133 5173 5208 5224 ...
..$ pop : num [1:12] 268151 268364 268595 268853 269108 ...
..$ psavert : num [1:12] 6.7 6.7 6.6 5.7 6.7 7.1 6.7 6.6 6.7 6.4 ...
..$ uempmed : num [1:12] 8.3 7.8 8.3 8.6 8.6 8.3 8.3 8.4 8.5 8.3 ...
..$ unemploy: num [1:12] 7491 7313 7318 7415 7423 ...
..$ year : num [1:12] 1996 1996 1996 1996 1996 ...
..$ percent : num [1:12] 0.0279 0.0273 0.0272 0.0276 0.0276 ...
$ 1997: tibble [12 × 8] (S3: tbl_df/tbl/data.frame)
..$ date : Date[1:12], format: "1997-01-01" "1997-02-01" ...
..$ pce : num [1:12] 5411 5434 5454 5459 5460 ...
..$ pop : num [1:12] 271360 271585 271821 272083 272342 ...
..$ psavert : num [1:12] 6.2 6.2 6.4 6.5 6.8 6.6 6.1 6 6.2 6.2 ...
..$ uempmed : num [1:12] 7.8 8.1 7.9 8.3 8 8 8.3 7.8 8.2 7.7 ...
..$ unemploy: num [1:12] 7158 7102 7000 6873 6655 ...
..$ year : num [1:12] 1997 1997 1997 1997 1997 ...
..$ percent : num [1:12] 0.0264 0.0262 0.0258 0.0253 0.0244 ...
$ 1998: tibble [12 × 8] (S3: tbl_df/tbl/data.frame)
..$ date : Date[1:12], format: "1998-01-01" "1998-02-01" ...
..$ pce : num [1:12] 5690 5724 5750 5788 5838 ...
..$ pop : num [1:12] 274626 274838 275047 275304 275564 ...
..$ psavert : num [1:12] 7.4 7.4 7.5 7.2 6.9 6.8 6.9 6.8 6.4 6.2 ...
..$ uempmed : num [1:12] 7.4 7 6.8 6.7 6 6.9 6.7 6.8 6.7 5.8 ...
..$ unemploy: num [1:12] 6368 6306 6422 5941 6047 ...
..$ year : num [1:12] 1998 1998 1998 1998 1998 ...
..$ percent : num [1:12] 0.0232 0.0229 0.0233 0.0216 0.0219 ...
$ 1999: tibble [12 × 8] (S3: tbl_df/tbl/data.frame)
..$ date : Date[1:12], format: "1999-01-01" "1999-02-01" ...
..$ pce : num [1:12] 6073 6102 6133 6196 6226 ...
..$ pop : num [1:12] 277790 277992 278198 278451 278717 ...
..$ psavert : num [1:12] 6.4 6.2 5.9 5.2 4.9 4.8 4.8 4.7 4.2 4.6 ...
..$ uempmed : num [1:12] 6.9 6.8 6.8 6.2 6.5 6.3 5.8 6.5 6 6.1 ...
..$ unemploy: num [1:12] 5976 6111 5783 6004 5796 ...
..$ year : num [1:12] 1999 1999 1999 1999 1999 ...
..$ percent : num [1:12] 0.0215 0.022 0.0208 0.0216 0.0208 ...
$ 2000: tibble [12 × 8] (S3: tbl_df/tbl/data.frame)
..$ date : Date[1:12], format: "2000-01-01" "2000-02-01" ...
..$ pce : num [1:12] 6535 6620 6686 6671 6708 ...
..$ pop : num [1:12] 280976 281190 281409 281653 281877 ...
..$ psavert : num [1:12] 5.4 4.8 4.5 5 4.9 4.9 5.2 5.2 4.5 4.6 ...
..$ uempmed : num [1:12] 5.8 6.1 6 6.1 5.8 5.7 6 6.3 5.2 6.1 ...
..$ unemploy: num [1:12] 5708 5858 5733 5481 5758 ...
..$ year : num [1:12] 2000 2000 2000 2000 2000 2000 2000 2000 2000 2000 ...
..$ percent : num [1:12] 0.0203 0.0208 0.0204 0.0195 0.0204 ...
$ 2001: tibble [12 × 8] (S3: tbl_df/tbl/data.frame)
..$ date : Date[1:12], format: "2001-01-01" "2001-02-01" ...
..$ pce : num [1:12] 6977 6996 6988 7001 7047 ...
..$ pop : num [1:12] 283920 284137 284350 284581 284810 ...
..$ psavert : num [1:12] 4.8 4.9 5.3 5 4.5 4.5 5.6 6.8 7 3.4 ...
..$ uempmed : num [1:12] 5.8 6.1 6.6 5.9 6.3 6 6.8 6.9 7.2 7.3 ...
..$ unemploy: num [1:12] 6023 6089 6141 6271 6226 ...
..$ year : num [1:12] 2001 2001 2001 2001 2001 ...
..$ percent : num [1:12] 0.0212 0.0214 0.0216 0.022 0.0219 ...
$ 2002: tibble [12 × 8] (S3: tbl_df/tbl/data.frame)
..$ date : Date[1:12], format: "2002-01-01" "2002-02-01" ...
..$ pce : num [1:12] 7174 7218 7237 7305 7283 ...
..$ pop : num [1:12] 286788 286994 287190 287397 287623 ...
..$ psavert : num [1:12] 6.1 5.8 5.9 5.8 6.5 6.4 5.5 5.4 5.7 5.7 ...
..$ uempmed : num [1:12] 8.4 8.3 8.4 8.9 9.5 11 8.9 9 9.5 9.6 ...
..$ unemploy: num [1:12] 8182 8215 8304 8599 8399 ...
..$ year : num [1:12] 2002 2002 2002 2002 2002 ...
..$ percent : num [1:12] 0.0285 0.0286 0.0289 0.0299 0.0292 ...
$ 2003: tibble [12 × 8] (S3: tbl_df/tbl/data.frame)
..$ date : Date[1:12], format: "2003-01-01" "2003-02-01" ...
..$ pce : num [1:12] 7533 7536 7598 7621 7628 ...
..$ pop : num [1:12] 289518 289714 289911 290125 290346 ...
..$ psavert : num [1:12] 5.5 5.6 5.3 5.3 5.8 5.6 6.3 6 5.2 5.3 ...
..$ uempmed : num [1:12] 9.6 9.5 9.7 10.2 9.9 11.5 10.3 10.1 10.2 10.4 ...
..$ unemploy: num [1:12] 8520 8618 8588 8842 8957 ...
..$ year : num [1:12] 2003 2003 2003 2003 2003 ...
..$ percent : num [1:12] 0.0294 0.0297 0.0296 0.0305 0.0308 ...
$ 2004: tibble [12 × 8] (S3: tbl_df/tbl/data.frame)
..$ date : Date[1:12], format: "2004-01-01" "2004-02-01" ...
..$ pce : num [1:12] 7987 8020 8076 8089 8163 ...
..$ pop : num [1:12] 292192 292368 292561 292779 292997 ...
..$ psavert : num [1:12] 5 5 4.9 5.3 5.3 5.8 5.3 5.2 4.6 4.5 ...
..$ uempmed : num [1:12] 10.6 10.2 10.2 9.5 9.9 11 8.9 9.2 9.6 9.5 ...
..$ unemploy: num [1:12] 8370 8167 8491 8170 8212 ...
..$ year : num [1:12] 2004 2004 2004 2004 2004 ...
..$ percent : num [1:12] 0.0286 0.0279 0.029 0.0279 0.028 ...
$ 2005: tibble [12 × 8] (S3: tbl_df/tbl/data.frame)
..$ date : Date[1:12], format: "2005-01-01" "2005-02-01" ...
..$ pce : num [1:12] 8470 8529 8570 8646 8644 ...
..$ pop : num [1:12] 294914 295105 295287 295490 295704 ...
..$ psavert : num [1:12] 3.7 3.4 3.6 3.1 3.5 2.9 2.2 2.7 2.7 3.1 ...
..$ uempmed : num [1:12] 9.4 9.2 9.3 9 9.1 9 8.8 9.2 8.4 8.6 ...
..$ unemploy: num [1:12] 7784 7980 7737 7672 7651 ...
..$ year : num [1:12] 2005 2005 2005 2005 2005 ...
..$ percent : num [1:12] 0.0264 0.027 0.0262 0.026 0.0259 ...
$ 2006: tibble [12 × 8] (S3: tbl_df/tbl/data.frame)
..$ date : Date[1:12], format: "2006-01-01" "2006-02-01" ...
..$ pce : num [1:12] 9060 9090 9122 9175 9215 ...
..$ pop : num [1:12] 297647 297854 298060 298281 298496 ...
..$ psavert : num [1:12] 4.2 4.2 4.2 4 3.8 4 3.4 3.6 3.6 3.6 ...
..$ uempmed : num [1:12] 8.6 9.1 8.7 8.4 8.5 7.3 8 8.4 8 7.9 ...
..$ unemploy: num [1:12] 7064 7184 7072 7120 6980 ...
..$ year : num [1:12] 2006 2006 2006 2006 2006 ...
..$ percent : num [1:12] 0.0237 0.0241 0.0237 0.0239 0.0234 ...
$ 2007: tibble [12 × 8] (S3: tbl_df/tbl/data.frame)
..$ date : Date[1:12], format: "2007-01-01" "2007-02-01" ...
..$ pce : num [1:12] 9516 9547 9585 9616 9651 ...
..$ pop : num [1:12] 300574 300802 301021 301254 301483 ...
..$ psavert : num [1:12] 3.7 4.1 4.4 4.2 4 3.8 3.7 3.4 3.5 3.4 ...
..$ uempmed : num [1:12] 8.3 8.5 9.1 8.6 8.2 7.7 8.7 8.8 8.7 8.4 ...
..$ unemploy: num [1:12] 7116 6927 6731 6850 6766 ...
..$ year : num [1:12] 2007 2007 2007 2007 2007 ...
..$ percent : num [1:12] 0.0237 0.023 0.0224 0.0227 0.0224 ...
$ 2008: tibble [12 × 8] (S3: tbl_df/tbl/data.frame)
..$ date : Date[1:12], format: "2008-01-01" "2008-02-01" ...
..$ pce : num [1:12] 9930 9913 9959 9997 10054 ...
..$ pop : num [1:12] 303506 303711 303907 304117 304323 ...
..$ psavert : num [1:12] 3.7 4.1 4 3.4 7.8 5.5 4.4 3.8 4.7 5.5 ...
..$ uempmed : num [1:12] 9 8.7 8.7 9.4 7.9 9 9.7 9.7 10.2 10.4 ...
..$ unemploy: num [1:12] 7685 7497 7822 7637 8395 ...
..$ year : num [1:12] 2008 2008 2008 2008 2008 ...
..$ percent : num [1:12] 0.0253 0.0247 0.0257 0.0251 0.0276 ...
$ 2009: tibble [12 × 8] (S3: tbl_df/tbl/data.frame)
..$ date : Date[1:12], format: "2009-01-01" "2009-02-01" ...
..$ pce : num [1:12] 9784 9766 9718 9725 9749 ...
..$ pop : num [1:12] 306208 306402 306588 306787 306984 ...
..$ psavert : num [1:12] 6.2 5.5 5.9 6.8 8.2 6.7 6 4.9 5.9 5.4 ...
..$ uempmed : num [1:12] 10.7 11.7 12.3 13.1 14.2 17.2 16 16.3 17.8 18.9 ...
..$ unemploy: num [1:12] 12058 12898 13426 13853 14499 ...
..$ year : num [1:12] 2009 2009 2009 2009 2009 ...
..$ percent : num [1:12] 0.0394 0.0421 0.0438 0.0452 0.0472 ...
$ 2010: tibble [12 × 8] (S3: tbl_df/tbl/data.frame)
..$ date : Date[1:12], format: "2010-01-01" "2010-02-01" ...
..$ pce : num [1:12] 10002 10031 10089 10113 10131 ...
..$ pop : num [1:12] 308833 309027 309212 309191 309369 ...
..$ psavert : num [1:12] 6.1 5.8 5.7 6.4 7 6.9 6.8 6.9 6.7 6.6 ...
..$ uempmed : num [1:12] 20 19.9 20.4 22.1 22.3 25.2 22.3 21 20.3 21.2 ...
..$ unemploy: num [1:12] 15046 15113 15202 15325 14849 ...
..$ year : num [1:12] 2010 2010 2010 2010 2010 2010 2010 2010 2010 2010 ...
..$ percent : num [1:12] 0.0487 0.0489 0.0492 0.0496 0.048 ...
$ 2011: tibble [12 × 8] (S3: tbl_df/tbl/data.frame)
..$ date : Date[1:12], format: "2011-01-01" "2011-02-01" ...
..$ pce : num [1:12] 10436 10470 10550 10588 10612 ...
..$ pop : num [1:12] 310961 311113 311265 311436 311607 ...
..$ psavert : num [1:12] 7.4 7.6 7 6.9 6.9 7.2 7.3 7.2 6.8 6.8 ...
..$ uempmed : num [1:12] 21.5 21.1 21.5 20.9 21.6 22.4 22 22.4 22 20.6 ...
..$ unemploy: num [1:12] 14013 13820 13737 13957 13855 ...
..$ year : num [1:12] 2011 2011 2011 2011 2011 ...
..$ percent : num [1:12] 0.0451 0.0444 0.0441 0.0448 0.0445 ...
$ 2012: tibble [12 × 8] (S3: tbl_df/tbl/data.frame)
..$ date : Date[1:12], format: "2012-01-01" "2012-02-01" ...
..$ pce : num [1:12] 10862 10954 10952 10980 10969 ...
..$ pop : num [1:12] 313183 313339 313499 313667 313831 ...
..$ psavert : num [1:12] 8 8 8.5 8.7 8.8 9.1 8.2 8 8.2 8.8 ...
..$ uempmed : num [1:12] 20.8 19.7 19.2 19.1 19.9 20.4 17.5 18.4 18.8 19.9 ...
..$ unemploy: num [1:12] 12797 12813 12713 12646 12660 ...
..$ year : num [1:12] 2012 2012 2012 2012 2012 ...
..$ percent : num [1:12] 0.0409 0.0409 0.0406 0.0403 0.0403 ...
$ 2013: tibble [12 × 8] (S3: tbl_df/tbl/data.frame)
..$ date : Date[1:12], format: "2013-01-01" "2013-02-01" ...
..$ pce : num [1:12] 11203 11240 11227 11205 11245 ...
..$ pop : num [1:12] 315390 315520 315662 315818 315984 ...
..$ psavert : num [1:12] 6.3 5.8 5.9 6.4 6.7 6.8 6.6 6.7 6.8 6.3 ...
..$ uempmed : num [1:12] 15.8 17.2 17.6 17.1 17.1 17 16.2 16.5 16.5 16.3 ...
..$ unemploy: num [1:12] 12471 11950 11689 11760 11654 ...
..$ year : num [1:12] 2013 2013 2013 2013 2013 ...
..$ percent : num [1:12] 0.0395 0.0379 0.037 0.0372 0.0369 ...
$ 2014: tibble [12 × 8] (S3: tbl_df/tbl/data.frame)
..$ date : Date[1:12], format: "2014-01-01" "2014-02-01" ...
..$ pce : num [1:12] 11512 11566 11643 11703 11748 ...
..$ pop : num [1:12] 317594 317754 317917 318089 318270 ...
..$ psavert : num [1:12] 7.1 7.3 7.4 7.4 7.4 7.4 7.5 7.2 7.4 7.2 ...
..$ uempmed : num [1:12] 15.4 15.9 15.8 15.7 14.6 13.8 13.1 12.9 13.4 13.6 ...
..$ unemploy: num [1:12] 10202 10349 10380 9702 9859 ...
..$ year : num [1:12] 2014 2014 2014 2014 2014 ...
..$ percent : num [1:12] 0.0321 0.0326 0.0327 0.0305 0.031 ...
$ 2015: tibble [4 × 8] (S3: tbl_df/tbl/data.frame)
..$ date : Date[1:4], format: "2015-01-01" "2015-02-01" ...
..$ pce : num [1:4] 12046 12082 12158 12194
..$ pop : num [1:4] 319929 320075 320231 320402
..$ psavert : num [1:4] 7.7 7.9 7.4 7.6
..$ uempmed : num [1:4] 13.2 12.9 12 11.5
..$ unemploy: num [1:4] 8903 8610 8504 8526
..$ year : num [1:4] 2015 2015 2015 2015
..$ percent : num [1:4] 0.0278 0.0269 0.0266 0.0266. . .
Could also do
by_year <- map(by_year,
               ~.x |>
                mutate(percent = unemploy / pop))
Fit the models
Fit a model of the form lm(percent ~ pce) to each year
You try first!
Fit the models
. . .
mods <- map(by_year,
            ~lm(percent ~ pce, data = .x)
            )
str(mods)
List of 49
$ 1967:List of 12
..$ coefficients : Named num [1:2] 8.40e-03 1.31e-05
.. ..- attr(*, "names")= chr [1:2] "(Intercept)" "pce"
..$ residuals : Named num [1:6] -0.000205 -0.000255 -0.000281 0.000677 0.000208 ...
.. ..- attr(*, "names")= chr [1:6] "1" "2" "3" "4" ...
..$ effects : Named num [1:6] -0.037041 0.00019 -0.000261 0.000737 0.000208 ...
.. ..- attr(*, "names")= chr [1:6] "(Intercept)" "pce" "" "" ...
..$ rank : int 2
..$ fitted.values: Named num [1:6] 0.015 0.0151 0.0151 0.0151 0.0152 ...
.. ..- attr(*, "names")= chr [1:6] "1" "2" "3" "4" ...
..$ assign : int [1:2] 0 1
..$ qr :List of 5
.. ..$ qr : num [1:6, 1:2] -2.449 0.408 0.408 0.408 0.408 ...
.. .. ..- attr(*, "dimnames")=List of 2
.. .. .. ..$ : chr [1:6] "1" "2" "3" "4" ...
.. .. .. ..$ : chr [1:2] "(Intercept)" "pce"
.. .. ..- attr(*, "assign")= int [1:2] 0 1
.. ..$ qraux: num [1:2] 1.41 1.17
.. ..$ pivot: int [1:2] 1 2
.. ..$ tol : num 1e-07
.. ..$ rank : int 2
.. ..- attr(*, "class")= chr "qr"
..$ df.residual : int 4
..$ xlevels : Named list()
..$ call : language lm(formula = percent ~ pce, data = .x)
..$ terms :Classes 'terms', 'formula' language percent ~ pce
.. .. ..- attr(*, "variables")= language list(percent, pce)
.. .. ..- attr(*, "factors")= int [1:2, 1] 0 1
.. .. .. ..- attr(*, "dimnames")=List of 2
.. .. .. .. ..$ : chr [1:2] "percent" "pce"
.. .. .. .. ..$ : chr "pce"
.. .. ..- attr(*, "term.labels")= chr "pce"
.. .. ..- attr(*, "order")= int 1
.. .. ..- attr(*, "intercept")= int 1
.. .. ..- attr(*, "response")= int 1
.. .. ..- attr(*, ".Environment")=<environment: 0x000002347b816c10>
.. .. ..- attr(*, "predvars")= language list(percent, pce)
.. .. ..- attr(*, "dataClasses")= Named chr [1:2] "numeric" "numeric"
.. .. .. ..- attr(*, "names")= chr [1:2] "percent" "pce"
..$ model :'data.frame': 6 obs. of 2 variables:
.. ..$ percent: num [1:6] 0.0148 0.0148 0.0149 0.0158 0.0154 ...
.. ..$ pce : num [1:6] 507 510 516 512 517 ...
.. ..- attr(*, "terms")=Classes 'terms', 'formula' language percent ~ pce
.. .. .. ..- attr(*, "variables")= language list(percent, pce)
.. .. .. ..- attr(*, "factors")= int [1:2, 1] 0 1
.. .. .. .. ..- attr(*, "dimnames")=List of 2
.. .. .. .. .. ..$ : chr [1:2] "percent" "pce"
.. .. .. .. .. ..$ : chr "pce"
.. .. .. ..- attr(*, "term.labels")= chr "pce"
.. .. .. ..- attr(*, "order")= int 1
.. .. .. ..- attr(*, "intercept")= int 1
.. .. .. ..- attr(*, "response")= int 1
.. .. .. ..- attr(*, ".Environment")=<environment: 0x000002347b816c10>
.. .. .. ..- attr(*, "predvars")= language list(percent, pce)
.. .. .. ..- attr(*, "dataClasses")= Named chr [1:2] "numeric" "numeric"
.. .. .. .. ..- attr(*, "names")= chr [1:2] "percent" "pce"
..- attr(*, "class")= chr "lm"
$ 1968:List of 12
..$ coefficients : Named num [1:2] 0.027846 -0.000025
.. ..- attr(*, "names")= chr [1:2] "(Intercept)" "pce"
..$ residuals : Named num [1:12] -0.000186 0.000489 0.000126 -0.000732 -0.000443 ...
.. ..- attr(*, "names")= chr [1:12] "1" "2" "3" "4" ...
..$ effects : Named num [1:12] -0.048297 -0.001335 0.000117 -0.000743 -0.00041 ...
.. ..- attr(*, "names")= chr [1:12] "(Intercept)" "pce" "" "" ...
..$ rank : int 2
..$ fitted.values: Named num [1:12] 0.0146 0.0145 0.0143 0.0143 0.0141 ...
.. ..- attr(*, "names")= chr [1:12] "1" "2" "3" "4" ...
..$ assign : int [1:2] 0 1
..$ qr :List of 5
.. ..$ qr : num [1:12, 1:2] -3.464 0.289 0.289 0.289 0.289 ...
.. .. ..- attr(*, "dimnames")=List of 2
.. .. .. ..$ : chr [1:12] "1" "2" "3" "4" ...
.. .. .. ..$ : chr [1:2] "(Intercept)" "pce"
.. .. ..- attr(*, "assign")= int [1:2] 0 1
.. ..$ qraux: num [1:2] 1.29 1.33
.. ..$ pivot: int [1:2] 1 2
.. ..$ tol : num 1e-07
.. ..$ rank : int 2
.. ..- attr(*, "class")= chr "qr"
..$ df.residual : int 10
..$ xlevels : Named list()
..$ call : language lm(formula = percent ~ pce, data = .x)
..$ terms :Classes 'terms', 'formula' language percent ~ pce
.. .. ..- attr(*, "variables")= language list(percent, pce)
.. .. ..- attr(*, "factors")= int [1:2, 1] 0 1
.. .. .. ..- attr(*, "dimnames")=List of 2
.. .. .. .. ..$ : chr [1:2] "percent" "pce"
.. .. .. .. ..$ : chr "pce"
.. .. ..- attr(*, "term.labels")= chr "pce"
.. .. ..- attr(*, "order")= int 1
.. .. ..- attr(*, "intercept")= int 1
.. .. ..- attr(*, "response")= int 1
.. .. ..- attr(*, ".Environment")=<environment: 0x000002347b922af8>
.. .. ..- attr(*, "predvars")= language list(percent, pce)
.. .. ..- attr(*, "dataClasses")= Named chr [1:2] "numeric" "numeric"
.. .. .. ..- attr(*, "names")= chr [1:2] "percent" "pce"
..$ model :'data.frame': 12 obs. of 2 variables:
.. ..$ percent: num [1:12] 0.0144 0.015 0.0144 0.0135 0.0137 ...
.. ..$ pce : num [1:12] 531 534 544 544 550 ...
.. ..- attr(*, "terms")=Classes 'terms', 'formula' language percent ~ pce
.. .. .. ..- attr(*, "variables")= language list(percent, pce)
.. .. .. ..- attr(*, "factors")= int [1:2, 1] 0 1
.. .. .. .. ..- attr(*, "dimnames")=List of 2
.. .. .. .. .. ..$ : chr [1:2] "percent" "pce"
.. .. .. .. .. ..$ : chr "pce"
.. .. .. ..- attr(*, "term.labels")= chr "pce"
.. .. .. ..- attr(*, "order")= int 1
.. .. .. ..- attr(*, "intercept")= int 1
.. .. .. ..- attr(*, "response")= int 1
.. .. .. ..- attr(*, ".Environment")=<environment: 0x000002347b922af8>
.. .. .. ..- attr(*, "predvars")= language list(percent, pce)
.. .. .. ..- attr(*, "dataClasses")= Named chr [1:2] "numeric" "numeric"
.. .. .. .. ..- attr(*, "names")= chr [1:2] "percent" "pce"
..- attr(*, "class")= chr "lm"
$ 1969:List of 12
..$ coefficients : Named num [1:2] -0.005363 0.000032
.. ..- attr(*, "names")= chr [1:2] "(Intercept)" "pce"
..$ residuals : Named num [1:12] 1.52e-04 -1.51e-04 -6.82e-05 -9.87e-06 -4.49e-04 ...
.. ..- attr(*, "names")= chr [1:12] "1" "2" "3" "4" ...
..$ effects : Named num [1:12] -4.84e-02 1.42e-03 -6.75e-05 -2.62e-05 -4.87e-04 ...
.. ..- attr(*, "names")= chr [1:12] "(Intercept)" "pce" "" "" ...
..$ rank : int 2
..$ fitted.values: Named num [1:12] 0.0133 0.0135 0.0135 0.0137 0.0139 ...
.. ..- attr(*, "names")= chr [1:12] "1" "2" "3" "4" ...
..$ assign : int [1:2] 0 1
..$ qr :List of 5
.. ..$ qr : num [1:12, 1:2] -3.464 0.289 0.289 0.289 0.289 ...
.. .. ..- attr(*, "dimnames")=List of 2
.. .. .. ..$ : chr [1:12] "1" "2" "3" "4" ...
.. .. .. ..$ : chr [1:2] "(Intercept)" "pce"
.. .. ..- attr(*, "assign")= int [1:2] 0 1
.. ..$ qraux: num [1:2] 1.29 1.24
.. ..$ pivot: int [1:2] 1 2
.. ..$ tol : num 1e-07
.. ..$ rank : int 2
.. ..- attr(*, "class")= chr "qr"
..$ df.residual : int 10
..$ xlevels : Named list()
..$ call : language lm(formula = percent ~ pce, data = .x)
..$ terms :Classes 'terms', 'formula' language percent ~ pce
.. .. ..- attr(*, "variables")= language list(percent, pce)
.. .. ..- attr(*, "factors")= int [1:2, 1] 0 1
.. .. .. ..- attr(*, "dimnames")=List of 2
.. .. .. .. ..$ : chr [1:2] "percent" "pce"
.. .. .. .. ..$ : chr "pce"
.. .. ..- attr(*, "term.labels")= chr "pce"
.. .. ..- attr(*, "order")= int 1
.. .. ..- attr(*, "intercept")= int 1
.. .. ..- attr(*, "response")= int 1
.. .. ..- attr(*, ".Environment")=<environment: 0x000002347bf7f628>
.. .. ..- attr(*, "predvars")= language list(percent, pce)
.. .. ..- attr(*, "dataClasses")= Named chr [1:2] "numeric" "numeric"
.. .. .. ..- attr(*, "names")= chr [1:2] "percent" "pce"
..$ model :'data.frame': 12 obs. of 2 variables:
.. ..$ percent: num [1:12] 0.0135 0.0133 0.0134 0.0136 0.0134 ...
.. ..$ pce : num [1:12] 584 589 589 594 600 ...
.. ..- attr(*, "terms")=Classes 'terms', 'formula' language percent ~ pce
.. .. .. ..- attr(*, "variables")= language list(percent, pce)
.. .. .. ..- attr(*, "factors")= int [1:2, 1] 0 1
.. .. .. .. ..- attr(*, "dimnames")=List of 2
.. .. .. .. .. ..$ : chr [1:2] "percent" "pce"
.. .. .. .. .. ..$ : chr "pce"
.. .. .. ..- attr(*, "term.labels")= chr "pce"
.. .. .. ..- attr(*, "order")= int 1
.. .. .. ..- attr(*, "intercept")= int 1
.. .. .. ..- attr(*, "response")= int 1
.. .. .. ..- attr(*, ".Environment")=<environment: 0x000002347bf7f628>
.. .. .. ..- attr(*, "predvars")= language list(percent, pce)
.. .. .. ..- attr(*, "dataClasses")= Named chr [1:2] "numeric" "numeric"
.. .. .. .. ..- attr(*, "names")= chr [1:2] "percent" "pce"
..- attr(*, "class")= chr "lm"
$ 1970:List of 12
..$ coefficients : Named num [1:2] -0.118058 0.000214
.. ..- attr(*, "names")= chr [1:2] "(Intercept)" "pce"
..$ residuals : Named num [1:12] -5.71e-04 -4.81e-04 7.62e-04 7.42e-04 -4.76e-05 ...
.. ..- attr(*, "names")= chr [1:12] "1" "2" "3" "4" ...
..$ effects : Named num [1:12] -6.97e-02 8.58e-03 9.65e-04 9.19e-04 8.25e-05 ...
.. ..- attr(*, "names")= chr [1:12] "(Intercept)" "pce" "" "" ...
..$ rank : int 2
..$ fitted.values: Named num [1:12] 0.0163 0.0174 0.017 0.0178 0.0192 ...
.. ..- attr(*, "names")= chr [1:12] "1" "2" "3" "4" ...
..$ assign : int [1:2] 0 1
..$ qr :List of 5
.. ..$ qr : num [1:12, 1:2] -3.464 0.289 0.289 0.289 0.289 ...
.. .. ..- attr(*, "dimnames")=List of 2
.. .. .. ..$ : chr [1:12] "1" "2" "3" "4" ...
.. .. .. ..$ : chr [1:2] "(Intercept)" "pce"
.. .. ..- attr(*, "assign")= int [1:2] 0 1
.. ..$ qraux: num [1:2] 1.29 1.22
.. ..$ pivot: int [1:2] 1 2
.. ..$ tol : num 1e-07
.. ..$ rank : int 2
.. ..- attr(*, "class")= chr "qr"
..$ df.residual : int 10
..$ xlevels : Named list()
..$ call : language lm(formula = percent ~ pce, data = .x)
..$ terms :Classes 'terms', 'formula' language percent ~ pce
.. .. ..- attr(*, "variables")= language list(percent, pce)
.. .. ..- attr(*, "factors")= int [1:2, 1] 0 1
.. .. .. ..- attr(*, "dimnames")=List of 2
.. .. .. .. ..$ : chr [1:2] "percent" "pce"
.. .. .. .. ..$ : chr "pce"
.. .. ..- attr(*, "term.labels")= chr "pce"
.. .. ..- attr(*, "order")= int 1
.. .. ..- attr(*, "intercept")= int 1
.. .. ..- attr(*, "response")= int 1
.. .. ..- attr(*, ".Environment")=<environment: 0x000002347c060000>
.. .. ..- attr(*, "predvars")= language list(percent, pce)
.. .. ..- attr(*, "dataClasses")= Named chr [1:2] "numeric" "numeric"
.. .. .. ..- attr(*, "names")= chr [1:2] "percent" "pce"
..$ model :'data.frame': 12 obs. of 2 variables:
.. ..$ percent: num [1:12] 0.0157 0.0169 0.0178 0.0186 0.0192 ...
.. ..$ pce : num [1:12] 629 634 632 636 642 ...
.. ..- attr(*, "terms")=Classes 'terms', 'formula' language percent ~ pce
.. .. .. ..- attr(*, "variables")= language list(percent, pce)
.. .. .. ..- attr(*, "factors")= int [1:2, 1] 0 1
.. .. .. .. ..- attr(*, "dimnames")=List of 2
.. .. .. .. .. ..$ : chr [1:2] "percent" "pce"
.. .. .. .. .. ..$ : chr "pce"
.. .. .. ..- attr(*, "term.labels")= chr "pce"
.. .. .. ..- attr(*, "order")= int 1
.. .. .. ..- attr(*, "intercept")= int 1
.. .. .. ..- attr(*, "response")= int 1
.. .. .. ..- attr(*, ".Environment")=<environment: 0x000002347c060000>
.. .. .. ..- attr(*, "predvars")= language list(percent, pce)
.. .. .. ..- attr(*, "dataClasses")= Named chr [1:2] "numeric" "numeric"
.. .. .. .. ..- attr(*, "names")= chr [1:2] "percent" "pce"
..- attr(*, "class")= chr "lm"
$ 1971:List of 12
..$ coefficients : Named num [1:2] 1.59e-02 1.18e-05
.. ..- attr(*, "names")= chr [1:2] "(Intercept)" "pce"
..$ residuals : Named num [1:12] 2.40e-04 -2.24e-04 1.30e-04 -1.10e-04 1.92e-05 ...
.. ..- attr(*, "names")= chr [1:12] "1" "2" "3" "4" ...
..$ effects : Named num [1:12] -8.38e-02 6.67e-04 1.25e-04 -1.41e-04 -2.11e-05 ...
.. ..- attr(*, "names")= chr [1:12] "(Intercept)" "pce" "" "" ...
..$ rank : int 2
..$ fitted.values: Named num [1:12] 0.0239 0.0239 0.024 0.0241 0.0241 ...
.. ..- attr(*, "names")= chr [1:12] "1" "2" "3" "4" ...
..$ assign : int [1:2] 0 1
..$ qr :List of 5
.. ..$ qr : num [1:12, 1:2] -3.464 0.289 0.289 0.289 0.289 ...
.. .. ..- attr(*, "dimnames")=List of 2
.. .. .. ..$ : chr [1:12] "1" "2" "3" "4" ...
.. .. .. ..$ : chr [1:2] "(Intercept)" "pce"
.. .. ..- attr(*, "assign")= int [1:2] 0 1
.. ..$ qraux: num [1:2] 1.29 1.27
.. ..$ pivot: int [1:2] 1 2
.. ..$ tol : num 1e-07
.. ..$ rank : int 2
.. ..- attr(*, "class")= chr "qr"
..$ df.residual : int 10
..$ xlevels : Named list()
..$ call : language lm(formula = percent ~ pce, data = .x)
..$ terms :Classes 'terms', 'formula' language percent ~ pce
.. .. ..- attr(*, "variables")= language list(percent, pce)
.. .. ..- attr(*, "factors")= int [1:2, 1] 0 1
.. .. .. ..- attr(*, "dimnames")=List of 2
.. .. .. .. ..$ : chr [1:2] "percent" "pce"
.. .. .. .. ..$ : chr "pce"
.. .. ..- attr(*, "term.labels")= chr "pce"
.. .. ..- attr(*, "order")= int 1
.. .. ..- attr(*, "intercept")= int 1
.. .. ..- attr(*, "response")= int 1
.. .. ..- attr(*, ".Environment")=<environment: 0x000002347c14fcb8>
.. .. ..- attr(*, "predvars")= language list(percent, pce)
.. .. ..- attr(*, "dataClasses")= Named chr [1:2] "numeric" "numeric"
.. .. .. ..- attr(*, "names")= chr [1:2] "percent" "pce"
..$ model :'data.frame': 12 obs. of 2 variables:
.. ..$ percent: num [1:12] 0.0241 0.0237 0.0241 0.0239 0.0241 ...
.. ..$ pce : num [1:12] 676 679 682 689 691 ...
.. ..- attr(*, "terms")=Classes 'terms', 'formula' language percent ~ pce
.. .. .. ..- attr(*, "variables")= language list(percent, pce)
.. .. .. ..- attr(*, "factors")= int [1:2, 1] 0 1
.. .. .. .. ..- attr(*, "dimnames")=List of 2
.. .. .. .. .. ..$ : chr [1:2] "percent" "pce"
.. .. .. .. .. ..$ : chr "pce"
.. .. .. ..- attr(*, "term.labels")= chr "pce"
.. .. .. ..- attr(*, "order")= int 1
.. .. .. ..- attr(*, "intercept")= int 1
.. .. .. ..- attr(*, "response")= int 1
.. .. .. ..- attr(*, ".Environment")=<environment: 0x000002347c14fcb8>
.. .. .. ..- attr(*, "predvars")= language list(percent, pce)
.. .. .. ..- attr(*, "dataClasses")= Named chr [1:2] "numeric" "numeric"
.. .. .. .. ..- attr(*, "names")= chr [1:2] "percent" "pce"
..- attr(*, "class")= chr "lm"
$ 1972:List of 12
..$ coefficients : Named num [1:2] 4.40e-02 -2.71e-05
.. ..- attr(*, "names")= chr [1:2] "(Intercept)" "pce"
..$ residuals : Named num [1:12] -2.07e-04 -5.31e-04 3.30e-04 2.16e-05 -2.40e-05 ...
.. ..- attr(*, "names")= chr [1:12] "1" "2" "3" "4" ...
..$ effects : Named num [1:12] -8.05e-02 -2.19e-03 4.26e-04 1.02e-04 3.13e-05 ...
.. ..- attr(*, "names")= chr [1:12] "(Intercept)" "pce" "" "" ...
..$ rank : int 2
..$ fitted.values: Named num [1:12] 0.0242 0.0241 0.0238 0.0237 0.0235 ...
.. ..- attr(*, "names")= chr [1:12] "1" "2" "3" "4" ...
..$ assign : int [1:2] 0 1
..$ qr :List of 5
.. ..$ qr : num [1:12, 1:2] -3.464 0.289 0.289 0.289 0.289 ...
.. .. ..- attr(*, "dimnames")=List of 2
.. .. .. ..$ : chr [1:12] "1" "2" "3" "4" ...
.. .. .. ..$ : chr [1:2] "(Intercept)" "pce"
.. .. ..- attr(*, "assign")= int [1:2] 0 1
.. ..$ qraux: num [1:2] 1.29 1.29
.. ..$ pivot: int [1:2] 1 2
.. ..$ tol : num 1e-07
.. ..$ rank : int 2
.. ..- attr(*, "class")= chr "qr"
..$ df.residual : int 10
..$ xlevels : Named list()
..$ call : language lm(formula = percent ~ pce, data = .x)
..$ terms :Classes 'terms', 'formula' language percent ~ pce
.. .. ..- attr(*, "variables")= language list(percent, pce)
.. .. ..- attr(*, "factors")= int [1:2, 1] 0 1
.. .. .. ..- attr(*, "dimnames")=List of 2
.. .. .. .. ..$ : chr [1:2] "percent" "pce"
.. .. .. .. ..$ : chr "pce"
.. .. ..- attr(*, "term.labels")= chr "pce"
.. .. ..- attr(*, "order")= int 1
.. .. ..- attr(*, "intercept")= int 1
.. .. ..- attr(*, "response")= int 1
.. .. ..- attr(*, ".Environment")=<environment: 0x000002347c2c0cb8>
.. .. ..- attr(*, "predvars")= language list(percent, pce)
.. .. ..- attr(*, "dataClasses")= Named chr [1:2] "numeric" "numeric"
.. .. .. ..- attr(*, "names")= chr [1:2] "percent" "pce"
..$ model :'data.frame': 12 obs. of 2 variables:
.. ..$ percent: num [1:12] 0.024 0.0236 0.0241 0.0237 0.0235 ...
.. ..$ pce : num [1:12] 732 736 749 752 758 ...
.. ..- attr(*, "terms")=Classes 'terms', 'formula' language percent ~ pce
.. .. .. ..- attr(*, "variables")= language list(percent, pce)
.. .. .. ..- attr(*, "factors")= int [1:2, 1] 0 1
.. .. .. .. ..- attr(*, "dimnames")=List of 2
.. .. .. .. .. ..$ : chr [1:2] "percent" "pce"
.. .. .. .. .. ..$ : chr "pce"
.. .. .. ..- attr(*, "term.labels")= chr "pce"
.. .. .. ..- attr(*, "order")= int 1
.. .. .. ..- attr(*, "intercept")= int 1
.. .. .. ..- attr(*, "response")= int 1
.. .. .. ..- attr(*, ".Environment")=<environment: 0x000002347c2c0cb8>
.. .. .. ..- attr(*, "predvars")= language list(percent, pce)
.. .. .. ..- attr(*, "dataClasses")= Named chr [1:2] "numeric" "numeric"
.. .. .. .. ..- attr(*, "names")= chr [1:2] "percent" "pce"
..- attr(*, "class")= chr "lm"
$ 1973:List of 12
..$ coefficients : Named num [1:2] 2.57e-02 -6.05e-06
.. ..- attr(*, "names")= chr [1:2] "(Intercept)" "pce"
..$ residuals : Named num [1:12] -0.000273 0.000367 0.000121 0.00043 -0.000165 ...
.. ..- attr(*, "names")= chr [1:12] "1" "2" "3" "4" ...
..$ effects : Named num [1:12] -0.071281 -0.000404 0.000134 0.000458 -0.000106 ...
.. ..- attr(*, "names")= chr [1:12] "(Intercept)" "pce" "" "" ...
..$ rank : int 2
..$ fitted.values: Named num [1:12] 0.0208 0.0207 0.0207 0.0207 0.0206 ...
.. ..- attr(*, "names")= chr [1:12] "1" "2" "3" "4" ...
..$ assign : int [1:2] 0 1
..$ qr :List of 5
.. ..$ qr : num [1:12, 1:2] -3.464 0.289 0.289 0.289 0.289 ...
.. .. ..- attr(*, "dimnames")=List of 2
.. .. .. ..$ : chr [1:12] "1" "2" "3" "4" ...
.. .. .. ..$ : chr [1:2] "(Intercept)" "pce"
.. .. ..- attr(*, "assign")= int [1:2] 0 1
.. ..$ qraux: num [1:2] 1.29 1.24
.. ..$ pivot: int [1:2] 1 2
.. ..$ tol : num 1e-07
.. ..$ rank : int 2
.. ..- attr(*, "class")= chr "qr"
..$ df.residual : int 10
..$ xlevels : Named list()
..$ call : language lm(formula = percent ~ pce, data = .x)
..$ terms :Classes 'terms', 'formula' language percent ~ pce
.. .. ..- attr(*, "variables")= language list(percent, pce)
.. .. ..- attr(*, "factors")= int [1:2, 1] 0 1
.. .. .. ..- attr(*, "dimnames")=List of 2
.. .. .. .. ..$ : chr [1:2] "percent" "pce"
.. .. .. .. ..$ : chr "pce"
.. .. ..- attr(*, "term.labels")= chr "pce"
.. .. ..- attr(*, "order")= int 1
.. .. ..- attr(*, "intercept")= int 1
.. .. ..- attr(*, "response")= int 1
.. .. ..- attr(*, ".Environment")=<environment: 0x000002347c363858>
.. .. ..- attr(*, "predvars")= language list(percent, pce)
.. .. ..- attr(*, "dataClasses")= Named chr [1:2] "numeric" "numeric"
.. .. .. ..- attr(*, "names")= chr [1:2] "percent" "pce"
..$ model :'data.frame': 12 obs. of 2 variables:
.. ..$ percent: num [1:12] 0.0205 0.0211 0.0208 0.0211 0.0205 ...
.. ..$ pce : num [1:12] 816 826 833 836 842 ...
.. ..- attr(*, "terms")=Classes 'terms', 'formula' language percent ~ pce
.. .. .. ..- attr(*, "variables")= language list(percent, pce)
.. .. .. ..- attr(*, "factors")= int [1:2, 1] 0 1
.. .. .. .. ..- attr(*, "dimnames")=List of 2
.. .. .. .. .. ..$ : chr [1:2] "percent" "pce"
.. .. .. .. .. ..$ : chr "pce"
.. .. .. ..- attr(*, "term.labels")= chr "pce"
.. .. .. ..- attr(*, "order")= int 1
.. .. .. ..- attr(*, "intercept")= int 1
.. .. .. ..- attr(*, "response")= int 1
.. .. .. ..- attr(*, ".Environment")=<environment: 0x000002347c363858>
.. .. .. ..- attr(*, "predvars")= language list(percent, pce)
.. .. .. ..- attr(*, "dataClasses")= Named chr [1:2] "numeric" "numeric"
.. .. .. .. ..- attr(*, "names")= chr [1:2] "percent" "pce"
..- attr(*, "class")= chr "lm"
$ 1974:List of 12
..$ coefficients : Named num [1:2] -5.07e-02 8.05e-05
.. ..- attr(*, "names")= chr [1:2] "(Intercept)" "pce"
..$ residuals : Named num [1:12] 0.001297 0.001272 -0.000139 -0.000986 -0.001528 ...
.. ..- attr(*, "names")= chr [1:12] "1" "2" "3" "4" ...
..$ effects : Named num [1:12] -0.08379 0.007552 -0.000576 -0.001349 -0.001799 ...
.. ..- attr(*, "names")= chr [1:12] "(Intercept)" "pce" "" "" ...
..$ rank : int 2
..$ fitted.values: Named num [1:12] 0.0205 0.0209 0.0219 0.0226 0.0236 ...
.. ..- attr(*, "names")= chr [1:12] "1" "2" "3" "4" ...
..$ assign : int [1:2] 0 1
..$ qr :List of 5
.. ..$ qr : num [1:12, 1:2] -3.464 0.289 0.289 0.289 0.289 ...
.. .. ..- attr(*, "dimnames")=List of 2
.. .. .. ..$ : chr [1:12] "1" "2" "3" "4" ...
.. .. .. ..$ : chr [1:2] "(Intercept)" "pce"
.. .. ..- attr(*, "assign")= int [1:2] 0 1
.. ..$ qraux: num [1:2] 1.29 1.32
.. ..$ pivot: int [1:2] 1 2
.. ..$ tol : num 1e-07
.. ..$ rank : int 2
.. ..- attr(*, "class")= chr "qr"
..$ df.residual : int 10
..$ xlevels : Named list()
..$ call : language lm(formula = percent ~ pce, data = .x)
..$ terms :Classes 'terms', 'formula' language percent ~ pce
.. .. ..- attr(*, "variables")= language list(percent, pce)
.. .. ..- attr(*, "factors")= int [1:2, 1] 0 1
.. .. .. ..- attr(*, "dimnames")=List of 2
.. .. .. .. ..$ : chr [1:2] "percent" "pce"
.. .. .. .. ..$ : chr "pce"
.. .. ..- attr(*, "term.labels")= chr "pce"
.. .. ..- attr(*, "order")= int 1
.. .. ..- attr(*, "intercept")= int 1
.. .. ..- attr(*, "response")= int 1
.. .. ..- attr(*, ".Environment")=<environment: 0x000002347c40b150>
.. .. ..- attr(*, "predvars")= language list(percent, pce)
.. .. ..- attr(*, "dataClasses")= Named chr [1:2] "numeric" "numeric"
.. .. .. ..- attr(*, "names")= chr [1:2] "percent" "pce"
..$ model :'data.frame': 12 obs. of 2 variables:
.. ..$ percent: num [1:12] 0.0218 0.0222 0.0217 0.0216 0.022 ...
.. ..$ pce : num [1:12] 884 890 901 911 922 ...
.. ..- attr(*, "terms")=Classes 'terms', 'formula' language percent ~ pce
.. .. .. ..- attr(*, "variables")= language list(percent, pce)
.. .. .. ..- attr(*, "factors")= int [1:2, 1] 0 1
.. .. .. .. ..- attr(*, "dimnames")=List of 2
.. .. .. .. .. ..$ : chr [1:2] "percent" "pce"
.. .. .. .. .. ..$ : chr "pce"
.. .. .. ..- attr(*, "term.labels")= chr "pce"
.. .. .. ..- attr(*, "order")= int 1
.. .. .. ..- attr(*, "intercept")= int 1
.. .. .. ..- attr(*, "response")= int 1
.. .. .. ..- attr(*, ".Environment")=<environment: 0x000002347c40b150>
.. .. .. ..- attr(*, "predvars")= language list(percent, pce)
.. .. .. ..- attr(*, "dataClasses")= Named chr [1:2] "numeric" "numeric"
.. .. .. .. ..- attr(*, "names")= chr [1:2] "percent" "pce"
..- attr(*, "class")= chr "lm"
$ 1975:List of 12
..$ coefficients : Named num [1:2] 3.85e-02 -1.64e-06
.. ..- attr(*, "names")= chr [1:2] "(Intercept)" "pce"
..$ residuals : Named num [1:12] -0.001967 -0.001878 0.000231 0.001289 0.002333 ...
.. ..- attr(*, "names")= chr [1:12] "1" "2" "3" "4" ...
..$ effects : Named num [1:12] -0.127397 -0.000204 0.000931 0.001948 0.002767 ...
.. ..- attr(*, "names")= chr [1:12] "(Intercept)" "pce" "" "" ...
..$ rank : int 2
..$ fitted.values: Named num [1:12] 0.0369 0.0368 0.0368 0.0368 0.0368 ...
.. ..- attr(*, "names")= chr [1:12] "1" "2" "3" "4" ...
..$ assign : int [1:2] 0 1
..$ qr :List of 5
.. ..$ qr : num [1:12, 1:2] -3.464 0.289 0.289 0.289 0.289 ...
.. .. ..- attr(*, "dimnames")=List of 2
.. .. .. ..$ : chr [1:12] "1" "2" "3" "4" ...
.. .. .. ..$ : chr [1:2] "(Intercept)" "pce"
.. .. ..- attr(*, "assign")= int [1:2] 0 1
.. ..$ qraux: num [1:2] 1.29 1.23
.. ..$ pivot: int [1:2] 1 2
.. ..$ tol : num 1e-07
.. ..$ rank : int 2
.. ..- attr(*, "class")= chr "qr"
..$ df.residual : int 10
..$ xlevels : Named list()
..$ call : language lm(formula = percent ~ pce, data = .x)
..$ terms :Classes 'terms', 'formula' language percent ~ pce
.. .. ..- attr(*, "variables")= language list(percent, pce)
.. .. ..- attr(*, "factors")= int [1:2, 1] 0 1
.. .. .. ..- attr(*, "dimnames")=List of 2
.. .. .. .. ..$ : chr [1:2] "percent" "pce"
.. .. .. .. ..$ : chr "pce"
.. .. ..- attr(*, "term.labels")= chr "pce"
.. .. ..- attr(*, "order")= int 1
.. .. ..- attr(*, "intercept")= int 1
.. .. ..- attr(*, "response")= int 1
.. .. ..- attr(*, ".Environment")=<environment: 0x000002347c5536d0>
.. .. ..- attr(*, "predvars")= language list(percent, pce)
.. .. ..- attr(*, "dataClasses")= Named chr [1:2] "numeric" "numeric"
.. .. .. ..- attr(*, "names")= chr [1:2] "percent" "pce"
..$ model :'data.frame': 12 obs. of 2 variables:
.. ..$ percent: num [1:12] 0.0349 0.035 0.0371 0.0381 0.0391 ...
.. ..$ pce : num [1:12] 976 989 991 995 1019 ...
.. ..- attr(*, "terms")=Classes 'terms', 'formula' language percent ~ pce
.. .. .. ..- attr(*, "variables")= language list(percent, pce)
.. .. .. ..- attr(*, "factors")= int [1:2, 1] 0 1
.. .. .. .. ..- attr(*, "dimnames")=List of 2
.. .. .. .. .. ..$ : chr [1:2] "percent" "pce"
.. .. .. .. .. ..$ : chr "pce"
.. .. .. ..- attr(*, "term.labels")= chr "pce"
.. .. .. ..- attr(*, "order")= int 1
.. .. .. ..- attr(*, "intercept")= int 1
.. .. .. ..- attr(*, "response")= int 1
.. .. .. ..- attr(*, ".Environment")=<environment: 0x000002347c5536d0>
.. .. .. ..- attr(*, "predvars")= language list(percent, pce)
.. .. .. ..- attr(*, "dataClasses")= Named chr [1:2] "numeric" "numeric"
.. .. .. .. ..- attr(*, "names")= chr [1:2] "percent" "pce"
..- attr(*, "class")= chr "lm"
$ 1976:List of 12
..$ coefficients : Named num [1:2] 2.31e-02 9.41e-06
.. ..- attr(*, "names")= chr [1:2] "(Intercept)" "pce"
..$ residuals : Named num [1:12] 1.15e-03 1.62e-04 -3.68e-04 -2.95e-05 -1.30e-03 ...
.. ..- attr(*, "names")= chr [1:12] "1" "2" "3" "4" ...
..$ effects : Named num [1:12] -0.117558 0.00106 -0.00061 -0.000278 -0.001548 ...
.. ..- attr(*, "names")= chr [1:12] "(Intercept)" "pce" "" "" ...
..$ rank : int 2
..$ fitted.values: Named num [1:12] 0.0336 0.0336 0.0336 0.0337 0.0337 ...
.. ..- attr(*, "names")= chr [1:12] "1" "2" "3" "4" ...
..$ assign : int [1:2] 0 1
..$ qr :List of 5
.. ..$ qr : num [1:12, 1:2] -3.464 0.289 0.289 0.289 0.289 ...
.. .. ..- attr(*, "dimnames")=List of 2
.. .. .. ..$ : chr [1:12] "1" "2" "3" "4" ...
.. .. .. ..$ : chr [1:2] "(Intercept)" "pce"
.. .. ..- attr(*, "assign")= int [1:2] 0 1
.. ..$ qraux: num [1:2] 1.29 1.27
.. ..$ pivot: int [1:2] 1 2
.. ..$ tol : num 1e-07
.. ..$ rank : int 2
.. ..- attr(*, "class")= chr "qr"
..$ df.residual : int 10
..$ xlevels : Named list()
..$ call : language lm(formula = percent ~ pce, data = .x)
..$ terms :Classes 'terms', 'formula' language percent ~ pce
.. .. ..- attr(*, "variables")= language list(percent, pce)
.. .. ..- attr(*, "factors")= int [1:2, 1] 0 1
.. .. .. ..- attr(*, "dimnames")=List of 2
.. .. .. .. ..$ : chr [1:2] "percent" "pce"
.. .. .. .. ..$ : chr "pce"
.. .. ..- attr(*, "term.labels")= chr "pce"
.. .. ..- attr(*, "order")= int 1
.. .. ..- attr(*, "intercept")= int 1
.. .. ..- attr(*, "response")= int 1
.. .. ..- attr(*, ".Environment")=<environment: 0x000002347c66ece8>
.. .. ..- attr(*, "predvars")= language list(percent, pce)
.. .. ..- attr(*, "dataClasses")= Named chr [1:2] "numeric" "numeric"
.. .. .. ..- attr(*, "names")= chr [1:2] "percent" "pce"
..$ model :'data.frame': 12 obs. of 2 variables:
.. ..$ percent: num [1:12] 0.0347 0.0337 0.0333 0.0337 0.0324 ...
.. ..$ pce : num [1:12] 1107 1108 1115 1125 1123 ...
.. ..- attr(*, "terms")=Classes 'terms', 'formula' language percent ~ pce
.. .. .. ..- attr(*, "variables")= language list(percent, pce)
.. .. .. ..- attr(*, "factors")= int [1:2, 1] 0 1
.. .. .. .. ..- attr(*, "dimnames")=List of 2
.. .. .. .. .. ..$ : chr [1:2] "percent" "pce"
.. .. .. .. .. ..$ : chr "pce"
.. .. .. ..- attr(*, "term.labels")= chr "pce"
.. .. .. ..- attr(*, "order")= int 1
.. .. .. ..- attr(*, "intercept")= int 1
.. .. .. ..- attr(*, "response")= int 1
.. .. .. ..- attr(*, ".Environment")=<environment: 0x000002347c66ece8>
.. .. .. ..- attr(*, "predvars")= language list(percent, pce)
.. .. .. ..- attr(*, "dataClasses")= Named chr [1:2] "numeric" "numeric"
.. .. .. .. ..- attr(*, "names")= chr [1:2] "percent" "pce"
..- attr(*, "class")= chr "lm"
$ 1977:List of 12
..$ coefficients : Named num [1:2] 7.45e-02 -3.37e-05
.. ..- attr(*, "names")= chr [1:2] "(Intercept)" "pce"
..$ residuals : Named num [1:12] -0.000415 0.000852 0.000444 -0.000409 -0.000778 ...
.. ..- attr(*, "names")= chr [1:12] "1" "2" "3" "4" ...
..$ effects : Named num [1:12] -0.109618 -0.004303 0.000402 -0.000398 -0.000707 ...
.. ..- attr(*, "names")= chr [1:12] "(Intercept)" "pce" "" "" ...
..$ rank : int 2
..$ fitted.values: Named num [1:12] 0.0336 0.0331 0.0328 0.0325 0.0322 ...
.. ..- attr(*, "names")= chr [1:12] "1" "2" "3" "4" ...
..$ assign : int [1:2] 0 1
..$ qr :List of 5
.. ..$ qr : num [1:12, 1:2] -3.464 0.289 0.289 0.289 0.289 ...
.. .. ..- attr(*, "dimnames")=List of 2
.. .. .. ..$ : chr [1:12] "1" "2" "3" "4" ...
.. .. .. ..$ : chr [1:2] "(Intercept)" "pce"
.. .. ..- attr(*, "assign")= int [1:2] 0 1
.. ..$ qraux: num [1:2] 1.29 1.23
.. ..$ pivot: int [1:2] 1 2
.. ..$ tol : num 1e-07
.. ..$ rank : int 2
.. ..- attr(*, "class")= chr "qr"
..$ df.residual : int 10
..$ xlevels : Named list()
..$ call : language lm(formula = percent ~ pce, data = .x)
..$ terms :Classes 'terms', 'formula' language percent ~ pce
.. .. ..- attr(*, "variables")= language list(percent, pce)
.. .. ..- attr(*, "factors")= int [1:2, 1] 0 1
.. .. .. ..- attr(*, "dimnames")=List of 2
.. .. .. .. ..$ : chr [1:2] "percent" "pce"
.. .. .. .. ..$ : chr "pce"
.. .. ..- attr(*, "term.labels")= chr "pce"
.. .. ..- attr(*, "order")= int 1
.. .. ..- attr(*, "intercept")= int 1
.. .. ..- attr(*, "response")= int 1
.. .. ..- attr(*, ".Environment")=<environment: 0x000002347c72a0b0>
.. .. ..- attr(*, "predvars")= language list(percent, pce)
.. .. ..- attr(*, "dataClasses")= Named chr [1:2] "numeric" "numeric"
.. .. .. ..- attr(*, "names")= chr [1:2] "percent" "pce"
..$ model :'data.frame': 12 obs. of 2 variables:
.. ..$ percent: num [1:12] 0.0332 0.0339 0.0333 0.0321 0.0314 ...
.. ..$ pce : num [1:12] 1215 1231 1238 1247 1257 ...
.. ..- attr(*, "terms")=Classes 'terms', 'formula' language percent ~ pce
.. .. .. ..- attr(*, "variables")= language list(percent, pce)
.. .. .. ..- attr(*, "factors")= int [1:2, 1] 0 1
.. .. .. .. ..- attr(*, "dimnames")=List of 2
.. .. .. .. .. ..$ : chr [1:2] "percent" "pce"
.. .. .. .. .. ..$ : chr "pce"
.. .. .. ..- attr(*, "term.labels")= chr "pce"
.. .. .. ..- attr(*, "order")= int 1
.. .. .. ..- attr(*, "intercept")= int 1
.. .. .. ..- attr(*, "response")= int 1
.. .. .. ..- attr(*, ".Environment")=<environment: 0x000002347c72a0b0>
.. .. .. ..- attr(*, "predvars")= language list(percent, pce)
.. .. .. ..- attr(*, "dataClasses")= Named chr [1:2] "numeric" "numeric"
.. .. .. .. ..- attr(*, "names")= chr [1:2] "percent" "pce"
..- attr(*, "class")= chr "lm"
$ 1978:List of 12
..$ coefficients : Named num [1:2] 4.42e-02 -1.15e-05
.. ..- attr(*, "names")= chr [1:2] "(Intercept)" "pce"
..$ residuals : Named num [1:12] 4.25e-04 -7.19e-05 2.51e-04 -2.64e-04 -3.46e-04 ...
.. ..- attr(*, "names")= chr [1:12] "1" "2" "3" "4" ...
..$ effects : Named num [1:12] -0.096321 -0.00194 0.000174 -0.000356 -0.00045 ...
.. ..- attr(*, "names")= chr [1:12] "(Intercept)" "pce" "" "" ...
..$ rank : int 2
..$ fitted.values: Named num [1:12] 0.0289 0.0286 0.0283 0.0281 0.0279 ...
.. ..- attr(*, "names")= chr [1:12] "1" "2" "3" "4" ...
..$ assign : int [1:2] 0 1
..$ qr :List of 5
.. ..$ qr : num [1:12, 1:2] -3.464 0.289 0.289 0.289 0.289 ...
.. .. ..- attr(*, "dimnames")=List of 2
.. .. .. ..$ : chr [1:12] "1" "2" "3" "4" ...
.. .. .. ..$ : chr [1:2] "(Intercept)" "pce"
.. .. ..- attr(*, "assign")= int [1:2] 0 1
.. ..$ qraux: num [1:2] 1.29 1.28
.. ..$ pivot: int [1:2] 1 2
.. ..$ tol : num 1e-07
.. ..$ rank : int 2
.. ..- attr(*, "class")= chr "qr"
..$ df.residual : int 10
..$ xlevels : Named list()
..$ call : language lm(formula = percent ~ pce, data = .x)
..$ terms :Classes 'terms', 'formula' language percent ~ pce
.. .. ..- attr(*, "variables")= language list(percent, pce)
.. .. ..- attr(*, "factors")= int [1:2, 1] 0 1
.. .. .. ..- attr(*, "dimnames")=List of 2
.. .. .. .. ..$ : chr [1:2] "percent" "pce"
.. .. .. .. ..$ : chr "pce"
.. .. ..- attr(*, "term.labels")= chr "pce"
.. .. ..- attr(*, "order")= int 1
.. .. ..- attr(*, "intercept")= int 1
.. .. ..- attr(*, "response")= int 1
.. .. ..- attr(*, ".Environment")=<environment: 0x000002347c83c890>
.. .. ..- attr(*, "predvars")= language list(percent, pce)
.. .. ..- attr(*, "dataClasses")= Named chr [1:2] "numeric" "numeric"
.. .. .. ..- attr(*, "names")= chr [1:2] "percent" "pce"
..$ model :'data.frame': 12 obs. of 2 variables:
.. ..$ percent: num [1:12] 0.0293 0.0285 0.0286 0.0278 0.0276 ...
.. ..$ pce : num [1:12] 1330 1355 1378 1396 1412 ...
.. ..- attr(*, "terms")=Classes 'terms', 'formula' language percent ~ pce
.. .. .. ..- attr(*, "variables")= language list(percent, pce)
.. .. .. ..- attr(*, "factors")= int [1:2, 1] 0 1
.. .. .. .. ..- attr(*, "dimnames")=List of 2
.. .. .. .. .. ..$ : chr [1:2] "percent" "pce"
.. .. .. .. .. ..$ : chr "pce"
.. .. .. ..- attr(*, "term.labels")= chr "pce"
.. .. .. ..- attr(*, "order")= int 1
.. .. .. ..- attr(*, "intercept")= int 1
.. .. .. ..- attr(*, "response")= int 1
.. .. .. ..- attr(*, ".Environment")=<environment: 0x000002347c83c890>
.. .. .. ..- attr(*, "predvars")= language list(percent, pce)
.. .. .. ..- attr(*, "dataClasses")= Named chr [1:2] "numeric" "numeric"
.. .. .. .. ..- attr(*, "names")= chr [1:2] "percent" "pce"
..- attr(*, "class")= chr "lm"
$ 1979:List of 12
..$ coefficients : Named num [1:2] 1.93e-02 5.01e-06
.. ..- attr(*, "names")= chr [1:2] "(Intercept)" "pce"
..$ residuals : Named num [1:12] 4.38e-04 6.24e-04 2.49e-04 9.64e-06 -1.14e-03 ...
.. ..- attr(*, "names")= chr [1:12] "1" "2" "3" "4" ...
..$ effects : Named num [1:12] -9.45e-02 9.45e-04 7.17e-05 -1.51e-04 -1.25e-03 ...
.. ..- attr(*, "names")= chr [1:12] "(Intercept)" "pce" "" "" ...
..$ rank : int 2
..$ fitted.values: Named num [1:12] 0.0269 0.0269 0.027 0.027 0.0271 ...
.. ..- attr(*, "names")= chr [1:12] "1" "2" "3" "4" ...
..$ assign : int [1:2] 0 1
..$ qr :List of 5
.. ..$ qr : num [1:12, 1:2] -3.464 0.289 0.289 0.289 0.289 ...
.. .. ..- attr(*, "dimnames")=List of 2
.. .. .. ..$ : chr [1:12] "1" "2" "3" "4" ...
.. .. .. ..$ : chr [1:2] "(Intercept)" "pce"
.. .. ..- attr(*, "assign")= int [1:2] 0 1
.. ..$ qraux: num [1:2] 1.29 1.26
.. ..$ pivot: int [1:2] 1 2
.. ..$ tol : num 1e-07
.. ..$ rank : int 2
.. ..- attr(*, "class")= chr "qr"
..$ df.residual : int 10
..$ xlevels : Named list()
..$ call : language lm(formula = percent ~ pce, data = .x)
..$ terms :Classes 'terms', 'formula' language percent ~ pce
.. .. ..- attr(*, "variables")= language list(percent, pce)
.. .. ..- attr(*, "factors")= int [1:2, 1] 0 1
.. .. .. ..- attr(*, "dimnames")=List of 2
.. .. .. .. ..$ : chr [1:2] "percent" "pce"
.. .. .. .. ..$ : chr "pce"
.. .. ..- attr(*, "term.labels")= chr "pce"
.. .. ..- attr(*, "order")= int 1
.. .. ..- attr(*, "intercept")= int 1
.. .. ..- attr(*, "response")= int 1
.. .. ..- attr(*, ".Environment")=<environment: 0x000002347c89d968>
.. .. ..- attr(*, "predvars")= language list(percent, pce)
.. .. ..- attr(*, "dataClasses")= Named chr [1:2] "numeric" "numeric"
.. .. .. ..- attr(*, "names")= chr [1:2] "percent" "pce"
..$ model :'data.frame': 12 obs. of 2 variables:
.. ..$ percent: num [1:12] 0.0273 0.0276 0.0272 0.027 0.026 ...
.. ..$ pce : num [1:12] 1502 1518 1531 1538 1559 ...
.. ..- attr(*, "terms")=Classes 'terms', 'formula' language percent ~ pce
.. .. .. ..- attr(*, "variables")= language list(percent, pce)
.. .. .. ..- attr(*, "factors")= int [1:2, 1] 0 1
.. .. .. .. ..- attr(*, "dimnames")=List of 2
.. .. .. .. .. ..$ : chr [1:2] "percent" "pce"
.. .. .. .. .. ..$ : chr "pce"
.. .. .. ..- attr(*, "term.labels")= chr "pce"
.. .. .. ..- attr(*, "order")= int 1
.. .. .. ..- attr(*, "intercept")= int 1
.. .. .. ..- attr(*, "response")= int 1
.. .. .. ..- attr(*, ".Environment")=<environment: 0x000002347c89d968>
.. .. .. ..- attr(*, "predvars")= language list(percent, pce)
.. .. .. ..- attr(*, "dataClasses")= Named chr [1:2] "numeric" "numeric"
.. .. .. .. ..- attr(*, "names")= chr [1:2] "percent" "pce"
..- attr(*, "class")= chr "lm"
$ 1980:List of 12
..$ coefficients : Named num [1:2] -7.45e-03 2.35e-05
.. ..- attr(*, "names")= chr [1:2] "(Intercept)" "pce"
..$ residuals : Named num [1:12] -2.93e-03 -2.97e-03 -3.03e-03 1.61e-05 2.63e-03 ...
.. ..- attr(*, "names")= chr [1:12] "1" "2" "3" "4" ...
..$ effects : Named num [1:12] -0.11672 0.00441 -0.00206 0.00112 0.00368 ...
.. ..- attr(*, "names")= chr [1:12] "(Intercept)" "pce" "" "" ...
..$ rank : int 2
..$ fitted.values: Named num [1:12] 0.0324 0.0325 0.0327 0.0324 0.0325 ...
.. ..- attr(*, "names")= chr [1:12] "1" "2" "3" "4" ...
..$ assign : int [1:2] 0 1
..$ qr :List of 5
.. ..$ qr : num [1:12, 1:2] -3.464 0.289 0.289 0.289 0.289 ...
.. .. ..- attr(*, "dimnames")=List of 2
.. .. .. ..$ : chr [1:12] "1" "2" "3" "4" ...
.. .. .. ..$ : chr [1:2] "(Intercept)" "pce"
.. .. ..- attr(*, "assign")= int [1:2] 0 1
.. ..$ qraux: num [1:2] 1.29 1.2
.. ..$ pivot: int [1:2] 1 2
.. ..$ tol : num 1e-07
.. ..$ rank : int 2
.. ..- attr(*, "class")= chr "qr"
..$ df.residual : int 10
..$ xlevels : Named list()
..$ call : language lm(formula = percent ~ pce, data = .x)
..$ terms :Classes 'terms', 'formula' language percent ~ pce
.. .. ..- attr(*, "variables")= language list(percent, pce)
.. .. ..- attr(*, "factors")= int [1:2, 1] 0 1
.. .. .. ..- attr(*, "dimnames")=List of 2
.. .. .. .. ..$ : chr [1:2] "percent" "pce"
.. .. .. .. ..$ : chr "pce"
.. .. ..- attr(*, "term.labels")= chr "pce"
.. .. ..- attr(*, "order")= int 1
.. .. ..- attr(*, "intercept")= int 1
.. .. ..- attr(*, "response")= int 1
.. .. ..- attr(*, ".Environment")=<environment: 0x000002347c90e078>
.. .. ..- attr(*, "predvars")= language list(percent, pce)
.. .. ..- attr(*, "dataClasses")= Named chr [1:2] "numeric" "numeric"
.. .. .. ..- attr(*, "names")= chr [1:2] "percent" "pce"
..$ model :'data.frame': 12 obs. of 2 variables:
.. ..$ percent: num [1:12] 0.0295 0.0296 0.0297 0.0324 0.0351 ...
.. ..$ pce : num [1:12] 1697 1701 1708 1695 1700 ...
.. ..- attr(*, "terms")=Classes 'terms', 'formula' language percent ~ pce
.. .. .. ..- attr(*, "variables")= language list(percent, pce)
.. .. .. ..- attr(*, "factors")= int [1:2, 1] 0 1
.. .. .. .. ..- attr(*, "dimnames")=List of 2
.. .. .. .. .. ..$ : chr [1:2] "percent" "pce"
.. .. .. .. .. ..$ : chr "pce"
.. .. .. ..- attr(*, "term.labels")= chr "pce"
.. .. .. ..- attr(*, "order")= int 1
.. .. .. ..- attr(*, "intercept")= int 1
.. .. .. ..- attr(*, "response")= int 1
.. .. .. ..- attr(*, ".Environment")=<environment: 0x000002347c90e078>
.. .. .. ..- attr(*, "predvars")= language list(percent, pce)
.. .. .. ..- attr(*, "dataClasses")= Named chr [1:2] "numeric" "numeric"
.. .. .. .. ..- attr(*, "names")= chr [1:2] "percent" "pce"
..- attr(*, "class")= chr "lm"
$ 1981:List of 12
..$ coefficients : Named num [1:2] -2.49e-02 3.15e-05
.. ..- attr(*, "names")= chr [1:2] "(Intercept)" "pce"
..$ residuals : Named num [1:12] 0.001276 0.00072 -0.000193 -0.00076 0.000246 ...
.. ..- attr(*, "names")= chr [1:12] "1" "2" "3" "4" ...
..$ effects : Named num [1:12] -0.124684 0.004009 -0.000524 -0.001087 -0.000055 ...
.. ..- attr(*, "names")= chr [1:12] "(Intercept)" "pce" "" "" ...
..$ rank : int 2
..$ fitted.values: Named num [1:12] 0.034 0.0344 0.035 0.0351 0.0354 ...
.. ..- attr(*, "names")= chr [1:12] "1" "2" "3" "4" ...
..$ assign : int [1:2] 0 1
..$ qr :List of 5
.. ..$ qr : num [1:12, 1:2] -3.464 0.289 0.289 0.289 0.289 ...
.. .. ..- attr(*, "dimnames")=List of 2
.. .. .. ..$ : chr [1:12] "1" "2" "3" "4" ...
.. .. .. ..$ : chr [1:2] "(Intercept)" "pce"
.. .. ..- attr(*, "assign")= int [1:2] 0 1
.. ..$ qraux: num [1:2] 1.29 1.28
.. ..$ pivot: int [1:2] 1 2
.. ..$ tol : num 1e-07
.. ..$ rank : int 2
.. ..- attr(*, "class")= chr "qr"
..$ df.residual : int 10
..$ xlevels : Named list()
..$ call : language lm(formula = percent ~ pce, data = .x)
..$ terms :Classes 'terms', 'formula' language percent ~ pce
.. .. ..- attr(*, "variables")= language list(percent, pce)
.. .. ..- attr(*, "factors")= int [1:2, 1] 0 1
.. .. .. ..- attr(*, "dimnames")=List of 2
.. .. .. .. ..$ : chr [1:2] "percent" "pce"
.. .. .. .. ..$ : chr "pce"
.. .. ..- attr(*, "term.labels")= chr "pce"
.. .. ..- attr(*, "order")= int 1
.. .. ..- attr(*, "intercept")= int 1
.. .. ..- attr(*, "response")= int 1
.. .. ..- attr(*, ".Environment")=<environment: 0x000002347c9a6120>
.. .. ..- attr(*, "predvars")= language list(percent, pce)
.. .. ..- attr(*, "dataClasses")= Named chr [1:2] "numeric" "numeric"
.. .. .. ..- attr(*, "names")= chr [1:2] "percent" "pce"
..$ model :'data.frame': 12 obs. of 2 variables:
.. ..$ percent: num [1:12] 0.0353 0.0351 0.0348 0.0343 0.0356 ...
.. ..$ pce : num [1:12] 1870 1884 1903 1904 1914 ...
.. ..- attr(*, "terms")=Classes 'terms', 'formula' language percent ~ pce
.. .. .. ..- attr(*, "variables")= language list(percent, pce)
.. .. .. ..- attr(*, "factors")= int [1:2, 1] 0 1
.. .. .. .. ..- attr(*, "dimnames")=List of 2
.. .. .. .. .. ..$ : chr [1:2] "percent" "pce"
.. .. .. .. .. ..$ : chr "pce"
.. .. .. ..- attr(*, "term.labels")= chr "pce"
.. .. .. ..- attr(*, "order")= int 1
.. .. .. ..- attr(*, "intercept")= int 1
.. .. .. ..- attr(*, "response")= int 1
.. .. .. ..- attr(*, ".Environment")=<environment: 0x000002347c9a6120>
.. .. .. ..- attr(*, "predvars")= language list(percent, pce)
.. .. .. ..- attr(*, "dataClasses")= Named chr [1:2] "numeric" "numeric"
.. .. .. .. ..- attr(*, "names")= chr [1:2] "percent" "pce"
..- attr(*, "class")= chr "lm"
$ 1982:List of 12
..$ coefficients : Named num [1:2] -8.88e-02 6.52e-05
.. ..- attr(*, "names")= chr [1:2] "(Intercept)" "pce"
..$ residuals : Named num [1:12] -0.000667 -0.000933 -0.00033 0.001001 0.000176 ...
.. ..- attr(*, "names")= chr [1:12] "1" "2" "3" "4" ...
..$ effects : Named num [1:12] -1.60e-01 1.16e-02 -6.76e-05 1.26e-03 3.63e-04 ...
.. ..- attr(*, "names")= chr [1:12] "(Intercept)" "pce" "" "" ...
..$ rank : int 2
..$ fitted.values: Named num [1:12] 0.0413 0.0429 0.0431 0.0432 0.0444 ...
.. ..- attr(*, "names")= chr [1:12] "1" "2" "3" "4" ...
..$ assign : int [1:2] 0 1
..$ qr :List of 5
.. ..$ qr : num [1:12, 1:2] -3.464 0.289 0.289 0.289 0.289 ...
.. .. ..- attr(*, "dimnames")=List of 2
.. .. .. ..$ : chr [1:12] "1" "2" "3" "4" ...
.. .. .. ..$ : chr [1:2] "(Intercept)" "pce"
.. .. ..- attr(*, "assign")= int [1:2] 0 1
.. ..$ qraux: num [1:2] 1.29 1.19
.. ..$ pivot: int [1:2] 1 2
.. ..$ tol : num 1e-07
.. ..$ rank : int 2
.. ..- attr(*, "class")= chr "qr"
..$ df.residual : int 10
..$ xlevels : Named list()
..$ call : language lm(formula = percent ~ pce, data = .x)
..$ terms :Classes 'terms', 'formula' language percent ~ pce
.. .. ..- attr(*, "variables")= language list(percent, pce)
.. .. ..- attr(*, "factors")= int [1:2, 1] 0 1
.. .. .. ..- attr(*, "dimnames")=List of 2
.. .. .. .. ..$ : chr [1:2] "percent" "pce"
.. .. .. .. ..$ : chr "pce"
.. .. ..- attr(*, "term.labels")= chr "pce"
.. .. ..- attr(*, "order")= int 1
.. .. ..- attr(*, "intercept")= int 1
.. .. ..- attr(*, "response")= int 1
.. .. ..- attr(*, ".Environment")=<environment: 0x000002347cb12ba0>
.. .. ..- attr(*, "predvars")= language list(percent, pce)
.. .. ..- attr(*, "dataClasses")= Named chr [1:2] "numeric" "numeric"
.. .. .. ..- attr(*, "names")= chr [1:2] "percent" "pce"
..$ model :'data.frame': 12 obs. of 2 variables:
.. ..$ percent: num [1:12] 0.0407 0.042 0.0427 0.0442 0.0446 ...
.. ..$ pce : num [1:12] 1997 2021 2024 2026 2044 ...
.. ..- attr(*, "terms")=Classes 'terms', 'formula' language percent ~ pce
.. .. .. ..- attr(*, "variables")= language list(percent, pce)
.. .. .. ..- attr(*, "factors")= int [1:2, 1] 0 1
.. .. .. .. ..- attr(*, "dimnames")=List of 2
.. .. .. .. .. ..$ : chr [1:2] "percent" "pce"
.. .. .. .. .. ..$ : chr "pce"
.. .. .. ..- attr(*, "term.labels")= chr "pce"
.. .. .. ..- attr(*, "order")= int 1
.. .. .. ..- attr(*, "intercept")= int 1
.. .. .. ..- attr(*, "response")= int 1
.. .. .. ..- attr(*, ".Environment")=<environment: 0x000002347cb12ba0>
.. .. .. ..- attr(*, "predvars")= language list(percent, pce)
.. .. .. ..- attr(*, "dataClasses")= Named chr [1:2] "numeric" "numeric"
.. .. .. .. ..- attr(*, "names")= chr [1:2] "percent" "pce"
..- attr(*, "class")= chr "lm"
$ 1983:List of 12
..$ coefficients : Named num [1:2] 0.146101 -0.000044
.. ..- attr(*, "names")= chr [1:2] "(Intercept)" "pce"
..$ residuals : Named num [1:12] -0.000964 -0.000816 -0.000297 0.000108 0.00045 ...
.. ..- attr(*, "names")= chr [1:12] "1" "2" "3" "4" ...
..$ effects : Named num [1:12] -0.158172 -0.011088 0.000018 0.00038 0.000687 ...
.. ..- attr(*, "names")= chr [1:12] "(Intercept)" "pce" "" "" ...
..$ rank : int 2
..$ fitted.values: Named num [1:12] 0.0504 0.0503 0.0491 0.0481 0.0472 ...
.. ..- attr(*, "names")= chr [1:12] "1" "2" "3" "4" ...
..$ assign : int [1:2] 0 1
..$ qr :List of 5
.. ..$ qr : num [1:12, 1:2] -3.464 0.289 0.289 0.289 0.289 ...
.. .. ..- attr(*, "dimnames")=List of 2
.. .. .. ..$ : chr [1:12] "1" "2" "3" "4" ...
.. .. .. ..$ : chr [1:2] "(Intercept)" "pce"
.. .. ..- attr(*, "assign")= int [1:2] 0 1
.. ..$ qraux: num [1:2] 1.29 1.32
.. ..$ pivot: int [1:2] 1 2
.. ..$ tol : num 1e-07
.. ..$ rank : int 2
.. ..- attr(*, "class")= chr "qr"
..$ df.residual : int 10
..$ xlevels : Named list()
..$ call : language lm(formula = percent ~ pce, data = .x)
..$ terms :Classes 'terms', 'formula' language percent ~ pce
.. .. ..- attr(*, "variables")= language list(percent, pce)
.. .. ..- attr(*, "factors")= int [1:2, 1] 0 1
.. .. .. ..- attr(*, "dimnames")=List of 2
.. .. .. .. ..$ : chr [1:2] "percent" "pce"
.. .. .. .. ..$ : chr "pce"
.. .. ..- attr(*, "term.labels")= chr "pce"
.. .. ..- attr(*, "order")= int 1
.. .. ..- attr(*, "intercept")= int 1
.. .. ..- attr(*, "response")= int 1
.. .. ..- attr(*, ".Environment")=<environment: 0x000002347cba0c80>
.. .. ..- attr(*, "predvars")= language list(percent, pce)
.. .. ..- attr(*, "dataClasses")= Named chr [1:2] "numeric" "numeric"
.. .. .. ..- attr(*, "names")= chr [1:2] "percent" "pce"
..$ model :'data.frame': 12 obs. of 2 variables:
.. ..$ percent: num [1:12] 0.0494 0.0494 0.0488 0.0482 0.0477 ...
.. ..$ pce : num [1:12] 2174 2177 2203 2226 2246 ...
.. ..- attr(*, "terms")=Classes 'terms', 'formula' language percent ~ pce
.. .. .. ..- attr(*, "variables")= language list(percent, pce)
.. .. .. ..- attr(*, "factors")= int [1:2, 1] 0 1
.. .. .. .. ..- attr(*, "dimnames")=List of 2
.. .. .. .. .. ..$ : chr [1:2] "percent" "pce"
.. .. .. .. .. ..$ : chr "pce"
.. .. .. ..- attr(*, "term.labels")= chr "pce"
.. .. .. ..- attr(*, "order")= int 1
.. .. .. ..- attr(*, "intercept")= int 1
.. .. .. ..- attr(*, "response")= int 1
.. .. .. ..- attr(*, ".Environment")=<environment: 0x000002347cba0c80>
.. .. .. ..- attr(*, "predvars")= language list(percent, pce)
.. .. .. ..- attr(*, "dataClasses")= Named chr [1:2] "numeric" "numeric"
.. .. .. .. ..- attr(*, "names")= chr [1:2] "percent" "pce"
..- attr(*, "class")= chr "lm"
$ 1984:List of 12
..$ coefficients : Named num [1:2] 7.89e-02 -1.72e-05
.. ..- attr(*, "names")= chr [1:2] "(Intercept)" "pce"
..$ residuals : Named num [1:12] 9.20e-04 -2.97e-04 -2.89e-05 4.58e-04 -5.71e-04 ...
.. ..- attr(*, "names")= chr [1:12] "1" "2" "3" "4" ...
..$ effects : Named num [1:12] -0.125039 -0.003282 -0.00015 0.000287 -0.000774 ...
.. ..- attr(*, "names")= chr [1:12] "(Intercept)" "pce" "" "" ...
..$ rank : int 2
..$ fitted.values: Named num [1:12] 0.0373 0.0376 0.0371 0.0367 0.0364 ...
.. ..- attr(*, "names")= chr [1:12] "1" "2" "3" "4" ...
..$ assign : int [1:2] 0 1
..$ qr :List of 5
.. ..$ qr : num [1:12, 1:2] -3.464 0.289 0.289 0.289 0.289 ...
.. .. ..- attr(*, "dimnames")=List of 2
.. .. .. ..$ : chr [1:12] "1" "2" "3" "4" ...
.. .. .. ..$ : chr [1:2] "(Intercept)" "pce"
.. .. ..- attr(*, "assign")= int [1:2] 0 1
.. ..$ qraux: num [1:2] 1.29 1.38
.. ..$ pivot: int [1:2] 1 2
.. ..$ tol : num 1e-07
.. ..$ rank : int 2
.. ..- attr(*, "class")= chr "qr"
..$ df.residual : int 10
..$ xlevels : Named list()
..$ call : language lm(formula = percent ~ pce, data = .x)
..$ terms :Classes 'terms', 'formula' language percent ~ pce
.. .. ..- attr(*, "variables")= language list(percent, pce)
.. .. ..- attr(*, "factors")= int [1:2, 1] 0 1
.. .. .. ..- attr(*, "dimnames")=List of 2
.. .. .. .. ..$ : chr [1:2] "percent" "pce"
.. .. .. .. ..$ : chr "pce"
.. .. ..- attr(*, "term.labels")= chr "pce"
.. .. ..- attr(*, "order")= int 1
.. .. ..- attr(*, "intercept")= int 1
.. .. ..- attr(*, "response")= int 1
.. .. ..- attr(*, ".Environment")=<environment: 0x000002347ccc33b8>
.. .. ..- attr(*, "predvars")= language list(percent, pce)
.. .. ..- attr(*, "dataClasses")= Named chr [1:2] "numeric" "numeric"
.. .. .. ..- attr(*, "names")= chr [1:2] "percent" "pce"
..$ model :'data.frame': 12 obs. of 2 variables:
.. ..$ percent: num [1:12] 0.0383 0.0373 0.0371 0.0372 0.0358 ...
.. ..$ pce : num [1:12] 2419 2404 2432 2458 2474 ...
.. ..- attr(*, "terms")=Classes 'terms', 'formula' language percent ~ pce
.. .. .. ..- attr(*, "variables")= language list(percent, pce)
.. .. .. ..- attr(*, "factors")= int [1:2, 1] 0 1
.. .. .. .. ..- attr(*, "dimnames")=List of 2
.. .. .. .. .. ..$ : chr [1:2] "percent" "pce"
.. .. .. .. .. ..$ : chr "pce"
.. .. .. ..- attr(*, "term.labels")= chr "pce"
.. .. .. ..- attr(*, "order")= int 1
.. .. .. ..- attr(*, "intercept")= int 1
.. .. .. ..- attr(*, "response")= int 1
.. .. .. ..- attr(*, ".Environment")=<environment: 0x000002347ccc33b8>
.. .. .. ..- attr(*, "predvars")= language list(percent, pce)
.. .. .. ..- attr(*, "dataClasses")= Named chr [1:2] "numeric" "numeric"
.. .. .. .. ..- attr(*, "names")= chr [1:2] "percent" "pce"
..- attr(*, "class")= chr "lm"
$ 1985:List of 12
..$ coefficients : Named num [1:2] 5.37e-02 -6.93e-06
.. ..- attr(*, "names")= chr [1:2] "(Intercept)" "pce"
..$ residuals : Named num [1:12] -5.19e-05 -3.49e-04 -2.39e-04 4.79e-05 -1.13e-04 ...
.. ..- attr(*, "names")= chr [1:12] "1" "2" "3" "4" ...
..$ effects : Named num [1:12] -0.120795 -0.00147 -0.000172 0.000101 -0.000107 ...
.. ..- attr(*, "names")= chr [1:12] "(Intercept)" "pce" "" "" ...
..$ rank : int 2
..$ fitted.values: Named num [1:12] 0.0355 0.0354 0.0353 0.0352 0.035 ...
.. ..- attr(*, "names")= chr [1:12] "1" "2" "3" "4" ...
..$ assign : int [1:2] 0 1
..$ qr :List of 5
.. ..$ qr : num [1:12, 1:2] -3.464 0.289 0.289 0.289 0.289 ...
.. .. ..- attr(*, "dimnames")=List of 2
.. .. .. ..$ : chr [1:12] "1" "2" "3" "4" ...
.. .. .. ..$ : chr [1:2] "(Intercept)" "pce"
.. .. ..- attr(*, "assign")= int [1:2] 0 1
.. ..$ qraux: num [1:2] 1.29 1.24
.. ..$ pivot: int [1:2] 1 2
.. ..$ tol : num 1e-07
.. ..$ rank : int 2
.. ..- attr(*, "class")= chr "qr"
..$ df.residual : int 10
..$ xlevels : Named list()
..$ call : language lm(formula = percent ~ pce, data = .x)
..$ terms :Classes 'terms', 'formula' language percent ~ pce
.. .. ..- attr(*, "variables")= language list(percent, pce)
.. .. ..- attr(*, "factors")= int [1:2, 1] 0 1
.. .. .. ..- attr(*, "dimnames")=List of 2
.. .. .. .. ..$ : chr [1:2] "percent" "pce"
.. .. .. .. ..$ : chr "pce"
.. .. ..- attr(*, "term.labels")= chr "pce"
.. .. ..- attr(*, "order")= int 1
.. .. ..- attr(*, "intercept")= int 1
.. .. ..- attr(*, "response")= int 1
.. .. ..- attr(*, ".Environment")=<environment: 0x000002347cdc20e8>
.. .. ..- attr(*, "predvars")= language list(percent, pce)
.. .. ..- attr(*, "dataClasses")= Named chr [1:2] "numeric" "numeric"
.. .. .. ..- attr(*, "names")= chr [1:2] "percent" "pce"
..$ model :'data.frame': 12 obs. of 2 variables:
.. ..$ percent: num [1:12] 0.0355 0.035 0.0351 0.0353 0.0349 ...
.. ..$ pce : num [1:12] 2619 2641 2648 2660 2696 ...
.. ..- attr(*, "terms")=Classes 'terms', 'formula' language percent ~ pce
.. .. .. ..- attr(*, "variables")= language list(percent, pce)
.. .. .. ..- attr(*, "factors")= int [1:2, 1] 0 1
.. .. .. .. ..- attr(*, "dimnames")=List of 2
.. .. .. .. .. ..$ : chr [1:2] "percent" "pce"
.. .. .. .. .. ..$ : chr "pce"
.. .. .. ..- attr(*, "term.labels")= chr "pce"
.. .. .. ..- attr(*, "order")= int 1
.. .. .. ..- attr(*, "intercept")= int 1
.. .. .. ..- attr(*, "response")= int 1
.. .. .. ..- attr(*, ".Environment")=<environment: 0x000002347cdc20e8>
.. .. .. ..- attr(*, "predvars")= language list(percent, pce)
.. .. .. ..- attr(*, "dataClasses")= Named chr [1:2] "numeric" "numeric"
.. .. .. .. ..- attr(*, "names")= chr [1:2] "percent" "pce"
..- attr(*, "class")= chr "lm"
$ 1986:List of 12
..$ coefficients : Named num [1:2] 5.38e-02 -6.78e-06
.. ..- attr(*, "names")= chr [1:2] "(Intercept)" "pce"
..$ residuals : Named num [1:12] -0.002143 0.000321 0.000244 0.00022 0.000657 ...
.. ..- attr(*, "names")= chr [1:12] "1" "2" "3" "4" ...
..$ effects : Named num [1:12] -0.118716 -0.001349 0.000567 0.000579 0.001088 ...
.. ..- attr(*, "names")= chr [1:12] "(Intercept)" "pce" "" "" ...
..$ rank : int 2
..$ fitted.values: Named num [1:12] 0.0347 0.0347 0.0347 0.0346 0.0345 ...
.. ..- attr(*, "names")= chr [1:12] "1" "2" "3" "4" ...
..$ assign : int [1:2] 0 1
..$ qr :List of 5
.. ..$ qr : num [1:12, 1:2] -3.464 0.289 0.289 0.289 0.289 ...
.. .. ..- attr(*, "dimnames")=List of 2
.. .. .. ..$ : chr [1:12] "1" "2" "3" "4" ...
.. .. .. ..$ : chr [1:2] "(Intercept)" "pce"
.. .. ..- attr(*, "assign")= int [1:2] 0 1
.. ..$ qraux: num [1:2] 1.29 1.27
.. ..$ pivot: int [1:2] 1 2
.. ..$ tol : num 1e-07
.. ..$ rank : int 2
.. ..- attr(*, "class")= chr "qr"
..$ df.residual : int 10
..$ xlevels : Named list()
..$ call : language lm(formula = percent ~ pce, data = .x)
..$ terms :Classes 'terms', 'formula' language percent ~ pce
.. .. ..- attr(*, "variables")= language list(percent, pce)
.. .. ..- attr(*, "factors")= int [1:2, 1] 0 1
.. .. .. ..- attr(*, "dimnames")=List of 2
.. .. .. .. ..$ : chr [1:2] "percent" "pce"
.. .. .. .. ..$ : chr "pce"
.. .. ..- attr(*, "term.labels")= chr "pce"
.. .. ..- attr(*, "order")= int 1
.. .. ..- attr(*, "intercept")= int 1
.. .. ..- attr(*, "response")= int 1
.. .. ..- attr(*, ".Environment")=<environment: 0x000002347cf23620>
.. .. ..- attr(*, "predvars")= language list(percent, pce)
.. .. ..- attr(*, "dataClasses")= Named chr [1:2] "numeric" "numeric"
.. .. .. ..- attr(*, "names")= chr [1:2] "percent" "pce"
..$ model :'data.frame': 12 obs. of 2 variables:
.. ..$ percent: num [1:12] 0.0325 0.035 0.0349 0.0348 0.0351 ...
.. ..$ pce : num [1:12] 2827 2820 2824 2835 2858 ...
.. ..- attr(*, "terms")=Classes 'terms', 'formula' language percent ~ pce
.. .. .. ..- attr(*, "variables")= language list(percent, pce)
.. .. .. ..- attr(*, "factors")= int [1:2, 1] 0 1
.. .. .. .. ..- attr(*, "dimnames")=List of 2
.. .. .. .. .. ..$ : chr [1:2] "percent" "pce"
.. .. .. .. .. ..$ : chr "pce"
.. .. .. ..- attr(*, "term.labels")= chr "pce"
.. .. .. ..- attr(*, "order")= int 1
.. .. .. ..- attr(*, "intercept")= int 1
.. .. .. ..- attr(*, "response")= int 1
.. .. .. ..- attr(*, ".Environment")=<environment: 0x000002347cf23620>
.. .. .. ..- attr(*, "predvars")= language list(percent, pce)
.. .. .. ..- attr(*, "dataClasses")= Named chr [1:2] "numeric" "numeric"
.. .. .. .. ..- attr(*, "names")= chr [1:2] "percent" "pce"
..- attr(*, "class")= chr "lm"
$ 1987:List of 12
..$ coefficients : Named num [1:2] 9.15e-02 -1.98e-05
.. ..- attr(*, "names")= chr [1:2] "(Intercept)" "pce"
..$ residuals : Named num [1:12] -0.00069 0.000489 0.000687 -0.000152 0.000148 ...
.. ..- attr(*, "names")= chr [1:12] "1" "2" "3" "4" ...
..$ effects : Named num [1:12] -1.06e-01 -4.64e-03 7.68e-04 -1.16e-05 3.11e-04 ...
.. ..- attr(*, "names")= chr [1:12] "(Intercept)" "pce" "" "" ...
..$ rank : int 2
..$ fitted.values: Named num [1:12] 0.0333 0.032 0.0318 0.0313 0.0311 ...
.. ..- attr(*, "names")= chr [1:12] "1" "2" "3" "4" ...
..$ assign : int [1:2] 0 1
..$ qr :List of 5
.. ..$ qr : num [1:12, 1:2] -3.464 0.289 0.289 0.289 0.289 ...
.. .. ..- attr(*, "dimnames")=List of 2
.. .. .. ..$ : chr [1:12] "1" "2" "3" "4" ...
.. .. .. ..$ : chr [1:2] "(Intercept)" "pce"
.. .. ..- attr(*, "assign")= int [1:2] 0 1
.. ..$ qraux: num [1:2] 1.29 1.18
.. ..$ pivot: int [1:2] 1 2
.. ..$ tol : num 1e-07
.. ..$ rank : int 2
.. ..- attr(*, "class")= chr "qr"
..$ df.residual : int 10
..$ xlevels : Named list()
..$ call : language lm(formula = percent ~ pce, data = .x)
..$ terms :Classes 'terms', 'formula' language percent ~ pce
.. .. ..- attr(*, "variables")= language list(percent, pce)
.. .. ..- attr(*, "factors")= int [1:2, 1] 0 1
.. .. .. ..- attr(*, "dimnames")=List of 2
.. .. .. .. ..$ : chr [1:2] "percent" "pce"
.. .. .. .. ..$ : chr "pce"
.. .. ..- attr(*, "term.labels")= chr "pce"
.. .. ..- attr(*, "order")= int 1
.. .. ..- attr(*, "intercept")= int 1
.. .. ..- attr(*, "response")= int 1
.. .. ..- attr(*, ".Environment")=<environment: 0x000002347d07da88>
.. .. ..- attr(*, "predvars")= language list(percent, pce)
.. .. ..- attr(*, "dataClasses")= Named chr [1:2] "numeric" "numeric"
.. .. .. ..- attr(*, "names")= chr [1:2] "percent" "pce"
..$ model :'data.frame': 12 obs. of 2 variables:
.. ..$ percent: num [1:12] 0.0326 0.0325 0.0325 0.0311 0.0312 ...
.. ..$ pce : num [1:12] 2936 3002 3013 3039 3048 ...
.. ..- attr(*, "terms")=Classes 'terms', 'formula' language percent ~ pce
.. .. .. ..- attr(*, "variables")= language list(percent, pce)
.. .. .. ..- attr(*, "factors")= int [1:2, 1] 0 1
.. .. .. .. ..- attr(*, "dimnames")=List of 2
.. .. .. .. .. ..$ : chr [1:2] "percent" "pce"
.. .. .. .. .. ..$ : chr "pce"
.. .. .. ..- attr(*, "term.labels")= chr "pce"
.. .. .. ..- attr(*, "order")= int 1
.. .. .. ..- attr(*, "intercept")= int 1
.. .. .. ..- attr(*, "response")= int 1
.. .. .. ..- attr(*, ".Environment")=<environment: 0x000002347d07da88>
.. .. .. ..- attr(*, "predvars")= language list(percent, pce)
.. .. .. ..- attr(*, "dataClasses")= Named chr [1:2] "numeric" "numeric"
.. .. .. .. ..- attr(*, "names")= chr [1:2] "percent" "pce"
..- attr(*, "class")= chr "lm"
$ 1988:List of 12
..$ coefficients : Named num [1:2] 5.12e-02 -7.17e-06
.. ..- attr(*, "names")= chr [1:2] "(Intercept)" "pce"
..$ residuals : Named num [1:12] 0.000326 0.000265 0.000311 -0.000815 0.000114 ...
.. ..- attr(*, "names")= chr [1:12] "1" "2" "3" "4" ...
..$ effects : Named num [1:12] -9.47e-02 -1.95e-03 2.15e-04 -9.10e-04 3.56e-05 ...
.. ..- attr(*, "names")= chr [1:12] "(Intercept)" "pce" "" "" ...
..$ rank : int 2
..$ fitted.values: Named num [1:12] 0.0282 0.0281 0.0278 0.0278 0.0276 ...
.. ..- attr(*, "names")= chr [1:12] "1" "2" "3" "4" ...
..$ assign : int [1:2] 0 1
..$ qr :List of 5
.. ..$ qr : num [1:12, 1:2] -3.464 0.289 0.289 0.289 0.289 ...
.. .. ..- attr(*, "dimnames")=List of 2
.. .. .. ..$ : chr [1:12] "1" "2" "3" "4" ...
.. .. .. ..$ : chr [1:2] "(Intercept)" "pce"
.. .. ..- attr(*, "assign")= int [1:2] 0 1
.. ..$ qraux: num [1:2] 1.29 1.3
.. ..$ pivot: int [1:2] 1 2
.. ..$ tol : num 1e-07
.. ..$ rank : int 2
.. ..- attr(*, "class")= chr "qr"
..$ df.residual : int 10
..$ xlevels : Named list()
..$ call : language lm(formula = percent ~ pce, data = .x)
..$ terms :Classes 'terms', 'formula' language percent ~ pce
.. .. ..- attr(*, "variables")= language list(percent, pce)
.. .. ..- attr(*, "factors")= int [1:2, 1] 0 1
.. .. .. ..- attr(*, "dimnames")=List of 2
.. .. .. .. ..$ : chr [1:2] "percent" "pce"
.. .. .. .. ..$ : chr "pce"
.. .. ..- attr(*, "term.labels")= chr "pce"
.. .. ..- attr(*, "order")= int 1
.. .. ..- attr(*, "intercept")= int 1
.. .. ..- attr(*, "response")= int 1
.. .. ..- attr(*, ".Environment")=<environment: 0x000002347d1bf3f0>
.. .. ..- attr(*, "predvars")= language list(percent, pce)
.. .. ..- attr(*, "dataClasses")= Named chr [1:2] "numeric" "numeric"
.. .. .. ..- attr(*, "names")= chr [1:2] "percent" "pce"
..$ model :'data.frame': 12 obs. of 2 variables:
.. ..$ percent: num [1:12] 0.0285 0.0284 0.0281 0.027 0.0277 ...
.. ..$ pce : num [1:12] 3214 3221 3260 3263 3294 ...
.. ..- attr(*, "terms")=Classes 'terms', 'formula' language percent ~ pce
.. .. .. ..- attr(*, "variables")= language list(percent, pce)
.. .. .. ..- attr(*, "factors")= int [1:2, 1] 0 1
.. .. .. .. ..- attr(*, "dimnames")=List of 2
.. .. .. .. .. ..$ : chr [1:2] "percent" "pce"
.. .. .. .. .. ..$ : chr "pce"
.. .. .. ..- attr(*, "term.labels")= chr "pce"
.. .. .. ..- attr(*, "order")= int 1
.. .. .. ..- attr(*, "intercept")= int 1
.. .. .. ..- attr(*, "response")= int 1
.. .. .. ..- attr(*, ".Environment")=<environment: 0x000002347d1bf3f0>
.. .. .. ..- attr(*, "predvars")= language list(percent, pce)
.. .. .. ..- attr(*, "dataClasses")= Named chr [1:2] "numeric" "numeric"
.. .. .. .. ..- attr(*, "names")= chr [1:2] "percent" "pce"
..- attr(*, "class")= chr "lm"
$ 1989:List of 12
..$ coefficients : Named num [1:2] 1.05e-02 4.44e-06
.. ..- attr(*, "names")= chr [1:2] "(Intercept)" "pce"
..$ residuals : Named num [1:12] 1.17e-03 -1.76e-04 -8.65e-04 -1.46e-05 -4.50e-04 ...
.. ..- attr(*, "names")= chr [1:12] "1" "2" "3" "4" ...
..$ effects : Named num [1:12] -0.091384 0.000969 -0.00104 -0.000257 -0.000706 ...
.. ..- attr(*, "names")= chr [1:12] "(Intercept)" "pce" "" "" ...
..$ rank : int 2
..$ fitted.values: Named num [1:12] 0.026 0.026 0.026 0.0262 0.0263 ...
.. ..- attr(*, "names")= chr [1:12] "1" "2" "3" "4" ...
..$ assign : int [1:2] 0 1
..$ qr :List of 5
.. ..$ qr : num [1:12, 1:2] -3.464 0.289 0.289 0.289 0.289 ...
.. .. ..- attr(*, "dimnames")=List of 2
.. .. .. ..$ : chr [1:12] "1" "2" "3" "4" ...
.. .. .. ..$ : chr [1:2] "(Intercept)" "pce"
.. .. ..- attr(*, "assign")= int [1:2] 0 1
.. ..$ qraux: num [1:2] 1.29 1.31
.. ..$ pivot: int [1:2] 1 2
.. ..$ tol : num 1e-07
.. ..$ rank : int 2
.. ..- attr(*, "class")= chr "qr"
..$ df.residual : int 10
..$ xlevels : Named list()
..$ call : language lm(formula = percent ~ pce, data = .x)
..$ terms :Classes 'terms', 'formula' language percent ~ pce
.. .. ..- attr(*, "variables")= language list(percent, pce)
.. .. ..- attr(*, "factors")= int [1:2, 1] 0 1
.. .. .. ..- attr(*, "dimnames")=List of 2
.. .. .. .. ..$ : chr [1:2] "percent" "pce"
.. .. .. .. ..$ : chr "pce"
.. .. ..- attr(*, "term.labels")= chr "pce"
.. .. ..- attr(*, "order")= int 1
.. .. ..- attr(*, "intercept")= int 1
.. .. ..- attr(*, "response")= int 1
.. .. ..- attr(*, ".Environment")=<environment: 0x000002347d260770>
.. .. ..- attr(*, "predvars")= language list(percent, pce)
.. .. ..- attr(*, "dataClasses")= Named chr [1:2] "numeric" "numeric"
.. .. .. ..- attr(*, "names")= chr [1:2] "percent" "pce"
..$ model :'data.frame': 12 obs. of 2 variables:
.. ..$ percent: num [1:12] 0.0271 0.0258 0.0252 0.0262 0.0258 ...
.. ..$ pce : num [1:12] 3484 3488 3499 3543 3552 ...
.. ..- attr(*, "terms")=Classes 'terms', 'formula' language percent ~ pce
.. .. .. ..- attr(*, "variables")= language list(percent, pce)
.. .. .. ..- attr(*, "factors")= int [1:2, 1] 0 1
.. .. .. .. ..- attr(*, "dimnames")=List of 2
.. .. .. .. .. ..$ : chr [1:2] "percent" "pce"
.. .. .. .. .. ..$ : chr "pce"
.. .. .. ..- attr(*, "term.labels")= chr "pce"
.. .. .. ..- attr(*, "order")= int 1
.. .. .. ..- attr(*, "intercept")= int 1
.. .. .. ..- attr(*, "response")= int 1
.. .. .. ..- attr(*, ".Environment")=<environment: 0x000002347d260770>
.. .. .. ..- attr(*, "predvars")= language list(percent, pce)
.. .. .. ..- attr(*, "dataClasses")= Named chr [1:2] "numeric" "numeric"
.. .. .. .. ..- attr(*, "names")= chr [1:2] "percent" "pce"
..- attr(*, "class")= chr "lm"
$ 1990:List of 12
..$ coefficients : Named num [1:2] -7.12e-02 2.61e-05
.. ..- attr(*, "names")= chr [1:2] "(Intercept)" "pce"
..$ residuals : Named num [1:12] 9.66e-04 6.07e-04 -3.23e-04 4.93e-05 -3.51e-04 ...
.. ..- attr(*, "names")= chr [1:12] "1" "2" "3" "4" ...
..$ effects : Named num [1:12] -0.097801 0.004826 -0.000597 -0.000201 -0.000592 ...
.. ..- attr(*, "names")= chr [1:12] "(Intercept)" "pce" "" "" ...
..$ rank : int 2
..$ fitted.values: Named num [1:12] 0.0262 0.0261 0.0268 0.0272 0.0274 ...
.. ..- attr(*, "names")= chr [1:12] "1" "2" "3" "4" ...
..$ assign : int [1:2] 0 1
..$ qr :List of 5
.. ..$ qr : num [1:12, 1:2] -3.464 0.289 0.289 0.289 0.289 ...
.. .. ..- attr(*, "dimnames")=List of 2
.. .. .. ..$ : chr [1:12] "1" "2" "3" "4" ...
.. .. .. ..$ : chr [1:2] "(Intercept)" "pce"
.. .. ..- attr(*, "assign")= int [1:2] 0 1
.. ..$ qraux: num [1:2] 1.29 1.34
.. ..$ pivot: int [1:2] 1 2
.. ..$ tol : num 1e-07
.. ..$ rank : int 2
.. ..- attr(*, "class")= chr "qr"
..$ df.residual : int 10
..$ xlevels : Named list()
..$ call : language lm(formula = percent ~ pce, data = .x)
..$ terms :Classes 'terms', 'formula' language percent ~ pce
.. .. ..- attr(*, "variables")= language list(percent, pce)
.. .. ..- attr(*, "factors")= int [1:2, 1] 0 1
.. .. .. ..- attr(*, "dimnames")=List of 2
.. .. .. .. ..$ : chr [1:2] "percent" "pce"
.. .. .. .. ..$ : chr "pce"
.. .. ..- attr(*, "term.labels")= chr "pce"
.. .. ..- attr(*, "order")= int 1
.. .. ..- attr(*, "intercept")= int 1
.. .. ..- attr(*, "response")= int 1
.. .. ..- attr(*, ".Environment")=<environment: 0x000002347d36eaf0>
.. .. ..- attr(*, "predvars")= language list(percent, pce)
.. .. ..- attr(*, "dataClasses")= Named chr [1:2] "numeric" "numeric"
.. .. .. ..- attr(*, "names")= chr [1:2] "percent" "pce"
..$ model :'data.frame': 12 obs. of 2 variables:
.. ..$ percent: num [1:12] 0.0272 0.0267 0.0265 0.0273 0.027 ...
.. ..$ pce : num [1:12] 3731 3728 3755 3770 3776 ...
.. ..- attr(*, "terms")=Classes 'terms', 'formula' language percent ~ pce
.. .. .. ..- attr(*, "variables")= language list(percent, pce)
.. .. .. ..- attr(*, "factors")= int [1:2, 1] 0 1
.. .. .. .. ..- attr(*, "dimnames")=List of 2
.. .. .. .. .. ..$ : chr [1:2] "percent" "pce"
.. .. .. .. .. ..$ : chr "pce"
.. .. .. ..- attr(*, "term.labels")= chr "pce"
.. .. .. ..- attr(*, "order")= int 1
.. .. .. ..- attr(*, "intercept")= int 1
.. .. .. ..- attr(*, "response")= int 1
.. .. .. ..- attr(*, ".Environment")=<environment: 0x000002347d36eaf0>
.. .. .. ..- attr(*, "predvars")= language list(percent, pce)
.. .. .. ..- attr(*, "dataClasses")= Named chr [1:2] "numeric" "numeric"
.. .. .. .. ..- attr(*, "names")= chr [1:2] "percent" "pce"
..- attr(*, "class")= chr "lm"
$ 1991:List of 12
..$ coefficients : Named num [1:2] -3.86e-02 1.84e-05
.. ..- attr(*, "names")= chr [1:2] "(Intercept)" "pce"
..$ residuals : Named num [1:12] -3.86e-04 1.01e-04 4.89e-04 -2.06e-05 6.37e-04 ...
.. ..- attr(*, "names")= chr [1:12] "1" "2" "3" "4" ...
..$ effects : Named num [1:12] -1.18e-01 3.31e-03 5.69e-04 5.51e-05 7.34e-04 ...
.. ..- attr(*, "names")= chr [1:12] "(Intercept)" "pce" "" "" ...
..$ rank : int 2
..$ fitted.values: Named num [1:12] 0.0322 0.0327 0.0335 0.0334 0.0339 ...
.. ..- attr(*, "names")= chr [1:12] "1" "2" "3" "4" ...
..$ assign : int [1:2] 0 1
..$ qr :List of 5
.. ..$ qr : num [1:12, 1:2] -3.464 0.289 0.289 0.289 0.289 ...
.. .. ..- attr(*, "dimnames")=List of 2
.. .. .. ..$ : chr [1:12] "1" "2" "3" "4" ...
.. .. .. ..$ : chr [1:2] "(Intercept)" "pce"
.. .. ..- attr(*, "assign")= int [1:2] 0 1
.. ..$ qraux: num [1:2] 1.29 1.3
.. ..$ pivot: int [1:2] 1 2
.. ..$ tol : num 1e-07
.. ..$ rank : int 2
.. ..- attr(*, "class")= chr "qr"
..$ df.residual : int 10
..$ xlevels : Named list()
..$ call : language lm(formula = percent ~ pce, data = .x)
..$ terms :Classes 'terms', 'formula' language percent ~ pce
.. .. ..- attr(*, "variables")= language list(percent, pce)
.. .. ..- attr(*, "factors")= int [1:2, 1] 0 1
.. .. .. ..- attr(*, "dimnames")=List of 2
.. .. .. .. ..$ : chr [1:2] "percent" "pce"
.. .. .. .. ..$ : chr "pce"
.. .. ..- attr(*, "term.labels")= chr "pce"
.. .. ..- attr(*, "order")= int 1
.. .. ..- attr(*, "intercept")= int 1
.. .. ..- attr(*, "response")= int 1
.. .. ..- attr(*, ".Environment")=<environment: 0x000002347d47be78>
.. .. ..- attr(*, "predvars")= language list(percent, pce)
.. .. ..- attr(*, "dataClasses")= Named chr [1:2] "numeric" "numeric"
.. .. .. ..- attr(*, "names")= chr [1:2] "percent" "pce"
..$ model :'data.frame': 12 obs. of 2 variables:
.. ..$ percent: num [1:12] 0.0318 0.0328 0.034 0.0334 0.0345 ...
.. ..$ pce : num [1:12] 3841 3867 3913 3907 3933 ...
.. ..- attr(*, "terms")=Classes 'terms', 'formula' language percent ~ pce
.. .. .. ..- attr(*, "variables")= language list(percent, pce)
.. .. .. ..- attr(*, "factors")= int [1:2, 1] 0 1
.. .. .. .. ..- attr(*, "dimnames")=List of 2
.. .. .. .. .. ..$ : chr [1:2] "percent" "pce"
.. .. .. .. .. ..$ : chr "pce"
.. .. .. ..- attr(*, "term.labels")= chr "pce"
.. .. .. ..- attr(*, "order")= int 1
.. .. .. ..- attr(*, "intercept")= int 1
.. .. .. ..- attr(*, "response")= int 1
.. .. .. ..- attr(*, ".Environment")=<environment: 0x000002347d47be78>
.. .. .. ..- attr(*, "predvars")= language list(percent, pce)
.. .. .. ..- attr(*, "dataClasses")= Named chr [1:2] "numeric" "numeric"
.. .. .. .. ..- attr(*, "names")= chr [1:2] "percent" "pce"
..- attr(*, "class")= chr "lm"
$ 1992:List of 12
..$ coefficients : Named num [1:2] 3.49e-02 6.09e-07
.. ..- attr(*, "names")= chr [1:2] "(Intercept)" "pce"
..$ residuals : Named num [1:12] -0.000987 -0.00036 -0.000385 -0.000611 0.000614 ...
.. ..- attr(*, "names")= chr [1:12] "1" "2" "3" "4" ...
..$ effects : Named num [1:12] -0.12966 0.000169 -0.000141 -0.000373 0.000841 ...
.. ..- attr(*, "names")= chr [1:12] "(Intercept)" "pce" "" "" ...
..$ rank : int 2
..$ fitted.values: Named num [1:12] 0.0374 0.0374 0.0374 0.0374 0.0374 ...
.. ..- attr(*, "names")= chr [1:12] "1" "2" "3" "4" ...
..$ assign : int [1:2] 0 1
..$ qr :List of 5
.. ..$ qr : num [1:12, 1:2] -3.464 0.289 0.289 0.289 0.289 ...
.. .. ..- attr(*, "dimnames")=List of 2
.. .. .. ..$ : chr [1:12] "1" "2" "3" "4" ...
.. .. .. ..$ : chr [1:2] "(Intercept)" "pce"
.. .. ..- attr(*, "assign")= int [1:2] 0 1
.. ..$ qraux: num [1:2] 1.29 1.26
.. ..$ pivot: int [1:2] 1 2
.. ..$ tol : num 1e-07
.. ..$ rank : int 2
.. ..- attr(*, "class")= chr "qr"
..$ df.residual : int 10
..$ xlevels : Named list()
..$ call : language lm(formula = percent ~ pce, data = .x)
..$ terms :Classes 'terms', 'formula' language percent ~ pce
.. .. ..- attr(*, "variables")= language list(percent, pce)
.. .. ..- attr(*, "factors")= int [1:2, 1] 0 1
.. .. .. ..- attr(*, "dimnames")=List of 2
.. .. .. .. ..$ : chr [1:2] "percent" "pce"
.. .. .. .. ..$ : chr "pce"
.. .. ..- attr(*, "term.labels")= chr "pce"
.. .. ..- attr(*, "order")= int 1
.. .. ..- attr(*, "intercept")= int 1
.. .. ..- attr(*, "response")= int 1
.. .. ..- attr(*, ".Environment")=<environment: 0x000002347d5778c8>
.. .. ..- attr(*, "predvars")= language list(percent, pce)
.. .. ..- attr(*, "dataClasses")= Named chr [1:2] "numeric" "numeric"
.. .. .. ..- attr(*, "names")= chr [1:2] "percent" "pce"
..$ model :'data.frame': 12 obs. of 2 variables:
.. ..$ percent: num [1:12] 0.0364 0.037 0.037 0.0368 0.038 ...
.. ..$ pce : num [1:12] 4085 4100 4117 4132 4158 ...
.. ..- attr(*, "terms")=Classes 'terms', 'formula' language percent ~ pce
.. .. .. ..- attr(*, "variables")= language list(percent, pce)
.. .. .. ..- attr(*, "factors")= int [1:2, 1] 0 1
.. .. .. .. ..- attr(*, "dimnames")=List of 2
.. .. .. .. .. ..$ : chr [1:2] "percent" "pce"
.. .. .. .. .. ..$ : chr "pce"
.. .. .. ..- attr(*, "term.labels")= chr "pce"
.. .. .. ..- attr(*, "order")= int 1
.. .. .. ..- attr(*, "intercept")= int 1
.. .. .. ..- attr(*, "response")= int 1
.. .. .. ..- attr(*, ".Environment")=<environment: 0x000002347d5778c8>
.. .. .. ..- attr(*, "predvars")= language list(percent, pce)
.. .. .. ..- attr(*, "dataClasses")= Named chr [1:2] "numeric" "numeric"
.. .. .. .. ..- attr(*, "names")= chr [1:2] "percent" "pce"
..- attr(*, "class")= chr "lm"
$ 1993:List of 12
..$ coefficients : Named num [1:2] 9.54e-02 -1.37e-05
.. ..- attr(*, "names")= chr [1:2] "(Intercept)" "pce"
..$ residuals : Named num [1:12] 2.04e-04 -1.77e-04 -7.38e-04 -3.91e-06 5.08e-04 ...
.. ..- attr(*, "names")= chr [1:12] "1" "2" "3" "4" ...
..$ effects : Named num [1:12] -1.19e-01 -3.68e-03 -7.35e-04 -2.76e-05 4.65e-04 ...
.. ..- attr(*, "names")= chr [1:12] "(Intercept)" "pce" "" "" ...
..$ rank : int 2
..$ fitted.values: Named num [1:12] 0.0358 0.0356 0.0357 0.0351 0.0347 ...
.. ..- attr(*, "names")= chr [1:12] "1" "2" "3" "4" ...
..$ assign : int [1:2] 0 1
..$ qr :List of 5
.. ..$ qr : num [1:12, 1:2] -3.464 0.289 0.289 0.289 0.289 ...
.. .. ..- attr(*, "dimnames")=List of 2
.. .. .. ..$ : chr [1:12] "1" "2" "3" "4" ...
.. .. .. ..$ : chr [1:2] "(Intercept)" "pce"
.. .. ..- attr(*, "assign")= int [1:2] 0 1
.. ..$ qraux: num [1:2] 1.29 1.27
.. ..$ pivot: int [1:2] 1 2
.. ..$ tol : num 1e-07
.. ..$ rank : int 2
.. ..- attr(*, "class")= chr "qr"
..$ df.residual : int 10
..$ xlevels : Named list()
..$ call : language lm(formula = percent ~ pce, data = .x)
..$ terms :Classes 'terms', 'formula' language percent ~ pce
.. .. ..- attr(*, "variables")= language list(percent, pce)
.. .. ..- attr(*, "factors")= int [1:2, 1] 0 1
.. .. .. ..- attr(*, "dimnames")=List of 2
.. .. .. .. ..$ : chr [1:2] "percent" "pce"
.. .. .. .. ..$ : chr "pce"
.. .. ..- attr(*, "term.labels")= chr "pce"
.. .. ..- attr(*, "order")= int 1
.. .. ..- attr(*, "intercept")= int 1
.. .. ..- attr(*, "response")= int 1
.. .. ..- attr(*, ".Environment")=<environment: 0x000002347d676ea8>
.. .. ..- attr(*, "predvars")= language list(percent, pce)
.. .. ..- attr(*, "dataClasses")= Named chr [1:2] "numeric" "numeric"
.. .. .. ..- attr(*, "names")= chr [1:2] "percent" "pce"
..$ model :'data.frame': 12 obs. of 2 variables:
.. ..$ percent: num [1:12] 0.036 0.0355 0.0349 0.0351 0.0352 ...
.. ..$ pce : num [1:12] 4341 4355 4352 4393 4422 ...
.. ..- attr(*, "terms")=Classes 'terms', 'formula' language percent ~ pce
.. .. .. ..- attr(*, "variables")= language list(percent, pce)
.. .. .. ..- attr(*, "factors")= int [1:2, 1] 0 1
.. .. .. .. ..- attr(*, "dimnames")=List of 2
.. .. .. .. .. ..$ : chr [1:2] "percent" "pce"
.. .. .. .. .. ..$ : chr "pce"
.. .. .. ..- attr(*, "term.labels")= chr "pce"
.. .. .. ..- attr(*, "order")= int 1
.. .. .. ..- attr(*, "intercept")= int 1
.. .. .. ..- attr(*, "response")= int 1
.. .. .. ..- attr(*, ".Environment")=<environment: 0x000002347d676ea8>
.. .. .. ..- attr(*, "predvars")= language list(percent, pce)
.. .. .. ..- attr(*, "dataClasses")= Named chr [1:2] "numeric" "numeric"
.. .. .. .. ..- attr(*, "names")= chr [1:2] "percent" "pce"
..- attr(*, "class")= chr "lm"
$ 1994:List of 12
..$ coefficients : Named num [1:2] 1.3e-01 -2.1e-05
.. ..- attr(*, "names")= chr [1:2] "(Intercept)" "pce"
..$ residuals : Named num [1:12] -0.000201 0.000593 0.000415 0.000379 -0.001266 ...
.. ..- attr(*, "names")= chr [1:12] "1" "2" "3" "4" ...
..$ effects : Named num [1:12] -0.104941 -0.005787 0.000375 0.000387 -0.001262 ...
.. ..- attr(*, "names")= chr [1:12] "(Intercept)" "pce" "" "" ...
..$ rank : int 2
..$ fitted.values: Named num [1:12] 0.0332 0.0322 0.0319 0.0313 0.0314 ...
.. ..- attr(*, "names")= chr [1:12] "1" "2" "3" "4" ...
..$ assign : int [1:2] 0 1
..$ qr :List of 5
.. ..$ qr : num [1:12, 1:2] -3.464 0.289 0.289 0.289 0.289 ...
.. .. ..- attr(*, "dimnames")=List of 2
.. .. .. ..$ : chr [1:12] "1" "2" "3" "4" ...
.. .. .. ..$ : chr [1:2] "(Intercept)" "pce"
.. .. ..- attr(*, "assign")= int [1:2] 0 1
.. ..$ qraux: num [1:2] 1.29 1.21
.. ..$ pivot: int [1:2] 1 2
.. ..$ tol : num 1e-07
.. ..$ rank : int 2
.. ..- attr(*, "class")= chr "qr"
..$ df.residual : int 10
..$ xlevels : Named list()
..$ call : language lm(formula = percent ~ pce, data = .x)
..$ terms :Classes 'terms', 'formula' language percent ~ pce
.. .. ..- attr(*, "variables")= language list(percent, pce)
.. .. ..- attr(*, "factors")= int [1:2, 1] 0 1
.. .. .. ..- attr(*, "dimnames")=List of 2
.. .. .. .. ..$ : chr [1:2] "percent" "pce"
.. .. .. .. ..$ : chr "pce"
.. .. ..- attr(*, "term.labels")= chr "pce"
.. .. ..- attr(*, "order")= int 1
.. .. ..- attr(*, "intercept")= int 1
.. .. ..- attr(*, "response")= int 1
.. .. ..- attr(*, ".Environment")=<environment: 0x000002347d69ec10>
.. .. ..- attr(*, "predvars")= language list(percent, pce)
.. .. ..- attr(*, "dataClasses")= Named chr [1:2] "numeric" "numeric"
.. .. .. ..- attr(*, "names")= chr [1:2] "percent" "pce"
..$ model :'data.frame': 12 obs. of 2 variables:
.. ..$ percent: num [1:12] 0.0329 0.0327 0.0323 0.0317 0.0301 ...
.. ..$ pce : num [1:12] 4585 4633 4646 4671 4670 ...
.. ..- attr(*, "terms")=Classes 'terms', 'formula' language percent ~ pce
.. .. .. ..- attr(*, "variables")= language list(percent, pce)
.. .. .. ..- attr(*, "factors")= int [1:2, 1] 0 1
.. .. .. .. ..- attr(*, "dimnames")=List of 2
.. .. .. .. .. ..$ : chr [1:2] "percent" "pce"
.. .. .. .. .. ..$ : chr "pce"
.. .. .. ..- attr(*, "term.labels")= chr "pce"
.. .. .. ..- attr(*, "order")= int 1
.. .. .. ..- attr(*, "intercept")= int 1
.. .. .. ..- attr(*, "response")= int 1
.. .. .. ..- attr(*, ".Environment")=<environment: 0x000002347d69ec10>
.. .. .. ..- attr(*, "predvars")= language list(percent, pce)
.. .. .. ..- attr(*, "dataClasses")= Named chr [1:2] "numeric" "numeric"
.. .. .. .. ..- attr(*, "names")= chr [1:2] "percent" "pce"
..- attr(*, "class")= chr "lm"
$ 1995:List of 12
..$ coefficients : Named num [1:2] 2.40e-02 7.72e-07
.. ..- attr(*, "names")= chr [1:2] "(Intercept)" "pce"
..$ residuals : Named num [1:12] 0.000114 -0.000618 -0.000796 0.001025 0.000158 ...
.. ..- attr(*, "names")= chr [1:12] "1" "2" "3" "4" ...
..$ effects : Named num [1:12] -0.096293 0.000207 -0.000727 0.001086 0.00014 ...
.. ..- attr(*, "names")= chr [1:12] "(Intercept)" "pce" "" "" ...
..$ rank : int 2
..$ fitted.values: Named num [1:12] 0.0277 0.0277 0.0277 0.0277 0.0278 ...
.. ..- attr(*, "names")= chr [1:12] "1" "2" "3" "4" ...
..$ assign : int [1:2] 0 1
..$ qr :List of 5
.. ..$ qr : num [1:12, 1:2] -3.464 0.289 0.289 0.289 0.289 ...
.. .. ..- attr(*, "dimnames")=List of 2
.. .. .. ..$ : chr [1:12] "1" "2" "3" "4" ...
.. .. .. ..$ : chr [1:2] "(Intercept)" "pce"
.. .. ..- attr(*, "assign")= int [1:2] 0 1
.. ..$ qraux: num [1:2] 1.29 1.32
.. ..$ pivot: int [1:2] 1 2
.. ..$ tol : num 1e-07
.. ..$ rank : int 2
.. ..- attr(*, "class")= chr "qr"
..$ df.residual : int 10
..$ xlevels : Named list()
..$ call : language lm(formula = percent ~ pce, data = .x)
..$ terms :Classes 'terms', 'formula' language percent ~ pce
.. .. ..- attr(*, "variables")= language list(percent, pce)
.. .. ..- attr(*, "factors")= int [1:2, 1] 0 1
.. .. .. ..- attr(*, "dimnames")=List of 2
.. .. .. .. ..$ : chr [1:2] "percent" "pce"
.. .. .. .. ..$ : chr "pce"
.. .. ..- attr(*, "term.labels")= chr "pce"
.. .. ..- attr(*, "order")= int 1
.. .. ..- attr(*, "intercept")= int 1
.. .. ..- attr(*, "response")= int 1
.. .. ..- attr(*, ".Environment")=<environment: 0x000002347d7c28c8>
.. .. ..- attr(*, "predvars")= language list(percent, pce)
.. .. ..- attr(*, "dataClasses")= Named chr [1:2] "numeric" "numeric"
.. .. .. ..- attr(*, "names")= chr [1:2] "percent" "pce"
..$ model :'data.frame': 12 obs. of 2 variables:
.. ..$ percent: num [1:12] 0.0278 0.0271 0.0269 0.0288 0.0279 ...
.. ..$ pce : num [1:12] 4851 4851 4885 4890 4933 ...
.. ..- attr(*, "terms")=Classes 'terms', 'formula' language percent ~ pce
.. .. .. ..- attr(*, "variables")= language list(percent, pce)
.. .. .. ..- attr(*, "factors")= int [1:2, 1] 0 1
.. .. .. .. ..- attr(*, "dimnames")=List of 2
.. .. .. .. .. ..$ : chr [1:2] "percent" "pce"
.. .. .. .. .. ..$ : chr "pce"
.. .. .. ..- attr(*, "term.labels")= chr "pce"
.. .. .. ..- attr(*, "order")= int 1
.. .. .. ..- attr(*, "intercept")= int 1
.. .. .. ..- attr(*, "response")= int 1
.. .. .. ..- attr(*, ".Environment")=<environment: 0x000002347d7c28c8>
.. .. .. ..- attr(*, "predvars")= language list(percent, pce)
.. .. .. ..- attr(*, "dataClasses")= Named chr [1:2] "numeric" "numeric"
.. .. .. .. ..- attr(*, "names")= chr [1:2] "percent" "pce"
..- attr(*, "class")= chr "lm"
$ 1996:List of 12
..$ coefficients : Named num [1:2] 5.60e-02 -5.57e-06
.. ..- attr(*, "names")= chr [1:2] "(Intercept)" "pce"
..$ residuals : Named num [1:12] 2.26e-04 -1.97e-04 2.33e-05 5.51e-04 6.43e-04 ...
.. ..- attr(*, "names")= chr [1:12] "1" "2" "3" "4" ...
..$ effects : Named num [1:12] -9.29e-02 -1.62e-03 -3.18e-06 5.01e-04 5.82e-04 ...
.. ..- attr(*, "names")= chr [1:12] "(Intercept)" "pce" "" "" ...
..$ rank : int 2
..$ fitted.values: Named num [1:12] 0.0277 0.0274 0.0272 0.027 0.0269 ...
.. ..- attr(*, "names")= chr [1:12] "1" "2" "3" "4" ...
..$ assign : int [1:2] 0 1
..$ qr :List of 5
.. ..$ qr : num [1:12, 1:2] -3.464 0.289 0.289 0.289 0.289 ...
.. .. ..- attr(*, "dimnames")=List of 2
.. .. .. ..$ : chr [1:12] "1" "2" "3" "4" ...
.. .. .. ..$ : chr [1:2] "(Intercept)" "pce"
.. .. ..- attr(*, "assign")= int [1:2] 0 1
.. ..$ qraux: num [1:2] 1.29 1.26
.. ..$ pivot: int [1:2] 1 2
.. ..$ tol : num 1e-07
.. ..$ rank : int 2
.. ..- attr(*, "class")= chr "qr"
..$ df.residual : int 10
..$ xlevels : Named list()
..$ call : language lm(formula = percent ~ pce, data = .x)
..$ terms :Classes 'terms', 'formula' language percent ~ pce
.. .. ..- attr(*, "variables")= language list(percent, pce)
.. .. ..- attr(*, "factors")= int [1:2, 1] 0 1
.. .. .. ..- attr(*, "dimnames")=List of 2
.. .. .. .. ..$ : chr [1:2] "percent" "pce"
.. .. .. .. ..$ : chr "pce"
.. .. ..- attr(*, "term.labels")= chr "pce"
.. .. ..- attr(*, "order")= int 1
.. .. ..- attr(*, "intercept")= int 1
.. .. ..- attr(*, "response")= int 1
.. .. ..- attr(*, ".Environment")=<environment: 0x000002347d822190>
.. .. ..- attr(*, "predvars")= language list(percent, pce)
.. .. ..- attr(*, "dataClasses")= Named chr [1:2] "numeric" "numeric"
.. .. .. ..- attr(*, "names")= chr [1:2] "percent" "pce"
..$ model :'data.frame': 12 obs. of 2 variables:
.. ..$ percent: num [1:12] 0.0279 0.0273 0.0272 0.0276 0.0276 ...
.. ..$ pce : num [1:12] 5086 5133 5173 5208 5224 ...
.. ..- attr(*, "terms")=Classes 'terms', 'formula' language percent ~ pce
.. .. .. ..- attr(*, "variables")= language list(percent, pce)
.. .. .. ..- attr(*, "factors")= int [1:2, 1] 0 1
.. .. .. .. ..- attr(*, "dimnames")=List of 2
.. .. .. .. .. ..$ : chr [1:2] "percent" "pce"
.. .. .. .. .. ..$ : chr "pce"
.. .. .. ..- attr(*, "term.labels")= chr "pce"
.. .. .. ..- attr(*, "order")= int 1
.. .. .. ..- attr(*, "intercept")= int 1
.. .. .. ..- attr(*, "response")= int 1
.. .. .. ..- attr(*, ".Environment")=<environment: 0x000002347d822190>
.. .. .. ..- attr(*, "predvars")= language list(percent, pce)
.. .. .. ..- attr(*, "dataClasses")= Named chr [1:2] "numeric" "numeric"
.. .. .. .. ..- attr(*, "names")= chr [1:2] "percent" "pce"
..- attr(*, "class")= chr "lm"
$ 1997:List of 12
..$ coefficients : Named num [1:2] 7.97e-02 -9.94e-06
.. ..- attr(*, "names")= chr [1:2] "(Intercept)" "pce"
..$ residuals : Named num [1:12] 0.000463 0.000462 0.000265 -0.000176 -0.000991 ...
.. ..- attr(*, "names")= chr [1:12] "1" "2" "3" "4" ...
..$ effects : Named num [1:12] -0.085448 -0.003197 0.000112 -0.000324 -0.001139 ...
.. ..- attr(*, "names")= chr [1:12] "(Intercept)" "pce" "" "" ...
..$ rank : int 2
..$ fitted.values: Named num [1:12] 0.0259 0.0257 0.0255 0.0254 0.0254 ...
.. ..- attr(*, "names")= chr [1:12] "1" "2" "3" "4" ...
..$ assign : int [1:2] 0 1
..$ qr :List of 5
.. ..$ qr : num [1:12, 1:2] -3.464 0.289 0.289 0.289 0.289 ...
.. .. ..- attr(*, "dimnames")=List of 2
.. .. .. ..$ : chr [1:12] "1" "2" "3" "4" ...
.. .. .. ..$ : chr [1:2] "(Intercept)" "pce"
.. .. ..- attr(*, "assign")= int [1:2] 0 1
.. ..$ qraux: num [1:2] 1.29 1.23
.. ..$ pivot: int [1:2] 1 2
.. ..$ tol : num 1e-07
.. ..$ rank : int 2
.. ..- attr(*, "class")= chr "qr"
..$ df.residual : int 10
..$ xlevels : Named list()
..$ call : language lm(formula = percent ~ pce, data = .x)
..$ terms :Classes 'terms', 'formula' language percent ~ pce
.. .. ..- attr(*, "variables")= language list(percent, pce)
.. .. ..- attr(*, "factors")= int [1:2, 1] 0 1
.. .. .. ..- attr(*, "dimnames")=List of 2
.. .. .. .. ..$ : chr [1:2] "percent" "pce"
.. .. .. .. ..$ : chr "pce"
.. .. ..- attr(*, "term.labels")= chr "pce"
.. .. ..- attr(*, "order")= int 1
.. .. ..- attr(*, "intercept")= int 1
.. .. ..- attr(*, "response")= int 1
.. .. ..- attr(*, ".Environment")=<environment: 0x000002347d88d498>
.. .. ..- attr(*, "predvars")= language list(percent, pce)
.. .. ..- attr(*, "dataClasses")= Named chr [1:2] "numeric" "numeric"
.. .. .. ..- attr(*, "names")= chr [1:2] "percent" "pce"
..$ model :'data.frame': 12 obs. of 2 variables:
.. ..$ percent: num [1:12] 0.0264 0.0262 0.0258 0.0253 0.0244 ...
.. ..$ pce : num [1:12] 5411 5434 5454 5459 5460 ...
.. ..- attr(*, "terms")=Classes 'terms', 'formula' language percent ~ pce
.. .. .. ..- attr(*, "variables")= language list(percent, pce)
.. .. .. ..- attr(*, "factors")= int [1:2, 1] 0 1
.. .. .. .. ..- attr(*, "dimnames")=List of 2
.. .. .. .. .. ..$ : chr [1:2] "percent" "pce"
.. .. .. .. .. ..$ : chr "pce"
.. .. .. ..- attr(*, "term.labels")= chr "pce"
.. .. .. ..- attr(*, "order")= int 1
.. .. .. ..- attr(*, "intercept")= int 1
.. .. .. ..- attr(*, "response")= int 1
.. .. .. ..- attr(*, ".Environment")=<environment: 0x000002347d88d498>
.. .. .. ..- attr(*, "predvars")= language list(percent, pce)
.. .. .. ..- attr(*, "dataClasses")= Named chr [1:2] "numeric" "numeric"
.. .. .. .. ..- attr(*, "names")= chr [1:2] "percent" "pce"
..- attr(*, "class")= chr "lm"
$ 1998:List of 12
..$ coefficients : Named num [1:2] 3.59e-02 -2.28e-06
.. ..- attr(*, "names")= chr [1:2] "(Intercept)" "pce"
..$ residuals : Named num [1:12] 0.000283 0.000117 0.000582 -0.0011 -0.000622 ...
.. ..- attr(*, "names")= chr [1:12] "1" "2" "3" "4" ...
..$ effects : Named num [1:12] -0.077862 -0.00093 0.00051 -0.001169 -0.000686 ...
.. ..- attr(*, "names")= chr [1:12] "(Intercept)" "pce" "" "" ...
..$ rank : int 2
..$ fitted.values: Named num [1:12] 0.0229 0.0228 0.0228 0.0227 0.0226 ...
.. ..- attr(*, "names")= chr [1:12] "1" "2" "3" "4" ...
..$ assign : int [1:2] 0 1
..$ qr :List of 5
.. ..$ qr : num [1:12, 1:2] -3.464 0.289 0.289 0.289 0.289 ...
.. .. ..- attr(*, "dimnames")=List of 2
.. .. .. ..$ : chr [1:12] "1" "2" "3" "4" ...
.. .. .. ..$ : chr [1:2] "(Intercept)" "pce"
.. .. ..- attr(*, "assign")= int [1:2] 0 1
.. ..$ qraux: num [1:2] 1.29 1.27
.. ..$ pivot: int [1:2] 1 2
.. ..$ tol : num 1e-07
.. ..$ rank : int 2
.. ..- attr(*, "class")= chr "qr"
..$ df.residual : int 10
..$ xlevels : Named list()
..$ call : language lm(formula = percent ~ pce, data = .x)
..$ terms :Classes 'terms', 'formula' language percent ~ pce
.. .. ..- attr(*, "variables")= language list(percent, pce)
.. .. ..- attr(*, "factors")= int [1:2, 1] 0 1
.. .. .. ..- attr(*, "dimnames")=List of 2
.. .. .. .. ..$ : chr [1:2] "percent" "pce"
.. .. .. .. ..$ : chr "pce"
.. .. ..- attr(*, "term.labels")= chr "pce"
.. .. ..- attr(*, "order")= int 1
.. .. ..- attr(*, "intercept")= int 1
.. .. ..- attr(*, "response")= int 1
.. .. ..- attr(*, ".Environment")=<environment: 0x000002347d9501f8>
.. .. ..- attr(*, "predvars")= language list(percent, pce)
.. .. ..- attr(*, "dataClasses")= Named chr [1:2] "numeric" "numeric"
.. .. .. ..- attr(*, "names")= chr [1:2] "percent" "pce"
..$ model :'data.frame': 12 obs. of 2 variables:
.. ..$ percent: num [1:12] 0.0232 0.0229 0.0233 0.0216 0.0219 ...
.. ..$ pce : num [1:12] 5690 5724 5750 5788 5838 ...
.. ..- attr(*, "terms")=Classes 'terms', 'formula' language percent ~ pce
.. .. .. ..- attr(*, "variables")= language list(percent, pce)
.. .. .. ..- attr(*, "factors")= int [1:2, 1] 0 1
.. .. .. .. ..- attr(*, "dimnames")=List of 2
.. .. .. .. .. ..$ : chr [1:2] "percent" "pce"
.. .. .. .. .. ..$ : chr "pce"
.. .. .. ..- attr(*, "term.labels")= chr "pce"
.. .. .. ..- attr(*, "order")= int 1
.. .. .. ..- attr(*, "intercept")= int 1
.. .. .. ..- attr(*, "response")= int 1
.. .. .. ..- attr(*, ".Environment")=<environment: 0x000002347d9501f8>
.. .. .. ..- attr(*, "predvars")= language list(percent, pce)
.. .. .. ..- attr(*, "dataClasses")= Named chr [1:2] "numeric" "numeric"
.. .. .. .. ..- attr(*, "names")= chr [1:2] "percent" "pce"
..- attr(*, "class")= chr "lm"
$ 1999:List of 12
..$ coefficients : Named num [1:2] 3.92e-02 -2.89e-06
.. ..- attr(*, "names")= chr [1:2] "(Intercept)" "pce"
..$ residuals : Named num [1:12] -0.000142 0.000412 -0.000693 0.000265 -0.000417 ...
.. ..- attr(*, "names")= chr [1:12] "1" "2" "3" "4" ...
..$ effects : Named num [1:12] -0.072946 -0.001374 -0.000735 0.000269 -0.00039 ...
.. ..- attr(*, "names")= chr [1:12] "(Intercept)" "pce" "" "" ...
..$ rank : int 2
..$ fitted.values: Named num [1:12] 0.0217 0.0216 0.0215 0.0213 0.0212 ...
.. ..- attr(*, "names")= chr [1:12] "1" "2" "3" "4" ...
..$ assign : int [1:2] 0 1
..$ qr :List of 5
.. ..$ qr : num [1:12, 1:2] -3.464 0.289 0.289 0.289 0.289 ...
.. .. ..- attr(*, "dimnames")=List of 2
.. .. .. ..$ : chr [1:12] "1" "2" "3" "4" ...
.. .. .. ..$ : chr [1:2] "(Intercept)" "pce"
.. .. ..- attr(*, "assign")= int [1:2] 0 1
.. ..$ qraux: num [1:2] 1.29 1.28
.. ..$ pivot: int [1:2] 1 2
.. ..$ tol : num 1e-07
.. ..$ rank : int 2
.. ..- attr(*, "class")= chr "qr"
..$ df.residual : int 10
..$ xlevels : Named list()
..$ call : language lm(formula = percent ~ pce, data = .x)
..$ terms :Classes 'terms', 'formula' language percent ~ pce
.. .. ..- attr(*, "variables")= language list(percent, pce)
.. .. ..- attr(*, "factors")= int [1:2, 1] 0 1
.. .. .. ..- attr(*, "dimnames")=List of 2
.. .. .. .. ..$ : chr [1:2] "percent" "pce"
.. .. .. .. ..$ : chr "pce"
.. .. ..- attr(*, "term.labels")= chr "pce"
.. .. ..- attr(*, "order")= int 1
.. .. ..- attr(*, "intercept")= int 1
.. .. ..- attr(*, "response")= int 1
.. .. ..- attr(*, ".Environment")=<environment: 0x000002347d98b7e0>
.. .. ..- attr(*, "predvars")= language list(percent, pce)
.. .. ..- attr(*, "dataClasses")= Named chr [1:2] "numeric" "numeric"
.. .. .. ..- attr(*, "names")= chr [1:2] "percent" "pce"
..$ model :'data.frame': 12 obs. of 2 variables:
.. ..$ percent: num [1:12] 0.0215 0.022 0.0208 0.0216 0.0208 ...
.. ..$ pce : num [1:12] 6073 6102 6133 6196 6226 ...
.. ..- attr(*, "terms")=Classes 'terms', 'formula' language percent ~ pce
.. .. .. ..- attr(*, "variables")= language list(percent, pce)
.. .. .. ..- attr(*, "factors")= int [1:2, 1] 0 1
.. .. .. .. ..- attr(*, "dimnames")=List of 2
.. .. .. .. .. ..$ : chr [1:2] "percent" "pce"
.. .. .. .. .. ..$ : chr "pce"
.. .. .. ..- attr(*, "term.labels")= chr "pce"
.. .. .. ..- attr(*, "order")= int 1
.. .. .. ..- attr(*, "intercept")= int 1
.. .. .. ..- attr(*, "response")= int 1
.. .. .. ..- attr(*, ".Environment")=<environment: 0x000002347d98b7e0>
.. .. .. ..- attr(*, "predvars")= language list(percent, pce)
.. .. .. ..- attr(*, "dataClasses")= Named chr [1:2] "numeric" "numeric"
.. .. .. .. ..- attr(*, "names")= chr [1:2] "percent" "pce"
..- attr(*, "class")= chr "lm"
$ 2000:List of 12
..$ coefficients : Named num [1:2] 3.1e-02 -1.6e-06
.. ..- attr(*, "names")= chr [1:2] "(Intercept)" "pce"
..$ residuals : Named num [1:12] -0.000188 0.000465 0.000111 -0.000825 0.000201 ...
.. ..- attr(*, "names")= chr [1:12] "1" "2" "3" "4" ...
..$ effects : Named num [1:12] -0.069765 -0.000669 0.000127 -0.000823 0.000239 ...
.. ..- attr(*, "names")= chr [1:12] "(Intercept)" "pce" "" "" ...
..$ rank : int 2
..$ fitted.values: Named num [1:12] 0.0205 0.0204 0.0203 0.0203 0.0202 ...
.. ..- attr(*, "names")= chr [1:12] "1" "2" "3" "4" ...
..$ assign : int [1:2] 0 1
..$ qr :List of 5
.. ..$ qr : num [1:12, 1:2] -3.464 0.289 0.289 0.289 0.289 ...
.. .. ..- attr(*, "dimnames")=List of 2
.. .. .. ..$ : chr [1:12] "1" "2" "3" "4" ...
.. .. .. ..$ : chr [1:2] "(Intercept)" "pce"
.. .. ..- attr(*, "assign")= int [1:2] 0 1
.. ..$ qraux: num [1:2] 1.29 1.22
.. ..$ pivot: int [1:2] 1 2
.. ..$ tol : num 1e-07
.. ..$ rank : int 2
.. ..- attr(*, "class")= chr "qr"
..$ df.residual : int 10
..$ xlevels : Named list()
..$ call : language lm(formula = percent ~ pce, data = .x)
..$ terms :Classes 'terms', 'formula' language percent ~ pce
.. .. ..- attr(*, "variables")= language list(percent, pce)
.. .. ..- attr(*, "factors")= int [1:2, 1] 0 1
.. .. .. ..- attr(*, "dimnames")=List of 2
.. .. .. .. ..$ : chr [1:2] "percent" "pce"
.. .. .. .. ..$ : chr "pce"
.. .. ..- attr(*, "term.labels")= chr "pce"
.. .. ..- attr(*, "order")= int 1
.. .. ..- attr(*, "intercept")= int 1
.. .. ..- attr(*, "response")= int 1
.. .. ..- attr(*, ".Environment")=<environment: 0x000002347da77580>
.. .. ..- attr(*, "predvars")= language list(percent, pce)
.. .. ..- attr(*, "dataClasses")= Named chr [1:2] "numeric" "numeric"
.. .. .. ..- attr(*, "names")= chr [1:2] "percent" "pce"
..$ model :'data.frame': 12 obs. of 2 variables:
.. ..$ percent: num [1:12] 0.0203 0.0208 0.0204 0.0195 0.0204 ...
.. ..$ pce : num [1:12] 6535 6620 6686 6671 6708 ...
.. ..- attr(*, "terms")=Classes 'terms', 'formula' language percent ~ pce
.. .. .. ..- attr(*, "variables")= language list(percent, pce)
.. .. .. ..- attr(*, "factors")= int [1:2, 1] 0 1
.. .. .. .. ..- attr(*, "dimnames")=List of 2
.. .. .. .. .. ..$ : chr [1:2] "percent" "pce"
.. .. .. .. .. ..$ : chr "pce"
.. .. .. ..- attr(*, "term.labels")= chr "pce"
.. .. .. ..- attr(*, "order")= int 1
.. .. .. ..- attr(*, "intercept")= int 1
.. .. .. ..- attr(*, "response")= int 1
.. .. .. ..- attr(*, ".Environment")=<environment: 0x000002347da77580>
.. .. .. ..- attr(*, "predvars")= language list(percent, pce)
.. .. .. ..- attr(*, "dataClasses")= Named chr [1:2] "numeric" "numeric"
.. .. .. .. ..- attr(*, "names")= chr [1:2] "percent" "pce"
..- attr(*, "class")= chr "lm"
$ 2001:List of 12
..$ coefficients : Named num [1:2] -0.18813 0.00003
.. ..- attr(*, "names")= chr [1:2] "(Intercept)" "pce"
..$ residuals : Named num [1:12] -6.43e-05 -4.13e-04 -8.60e-06 3.15e-05 -1.52e-03 ...
.. ..- attr(*, "names")= chr [1:12] "1" "2" "3" "4" ...
..$ effects : Named num [1:12] -8.29e-02 7.69e-03 8.11e-05 1.04e-04 -1.51e-03 ...
.. ..- attr(*, "names")= chr [1:12] "(Intercept)" "pce" "" "" ...
..$ rank : int 2
..$ fitted.values: Named num [1:12] 0.0213 0.0218 0.0216 0.022 0.0234 ...
.. ..- attr(*, "names")= chr [1:12] "1" "2" "3" "4" ...
..$ assign : int [1:2] 0 1
..$ qr :List of 5
.. ..$ qr : num [1:12, 1:2] -3.464 0.289 0.289 0.289 0.289 ...
.. .. ..- attr(*, "dimnames")=List of 2
.. .. .. ..$ : chr [1:12] "1" "2" "3" "4" ...
.. .. .. ..$ : chr [1:2] "(Intercept)" "pce"
.. .. ..- attr(*, "assign")= int [1:2] 0 1
.. ..$ qraux: num [1:2] 1.29 1.2
.. ..$ pivot: int [1:2] 1 2
.. ..$ tol : num 1e-07
.. ..$ rank : int 2
.. ..- attr(*, "class")= chr "qr"
..$ df.residual : int 10
..$ xlevels : Named list()
..$ call : language lm(formula = percent ~ pce, data = .x)
..$ terms :Classes 'terms', 'formula' language percent ~ pce
.. .. ..- attr(*, "variables")= language list(percent, pce)
.. .. ..- attr(*, "factors")= int [1:2, 1] 0 1
.. .. .. ..- attr(*, "dimnames")=List of 2
.. .. .. .. ..$ : chr [1:2] "percent" "pce"
.. .. .. .. ..$ : chr "pce"
.. .. ..- attr(*, "term.labels")= chr "pce"
.. .. ..- attr(*, "order")= int 1
.. .. ..- attr(*, "intercept")= int 1
.. .. ..- attr(*, "response")= int 1
.. .. ..- attr(*, ".Environment")=<environment: 0x000002347db7b238>
.. .. ..- attr(*, "predvars")= language list(percent, pce)
.. .. ..- attr(*, "dataClasses")= Named chr [1:2] "numeric" "numeric"
.. .. .. ..- attr(*, "names")= chr [1:2] "percent" "pce"
..$ model :'data.frame': 12 obs. of 2 variables:
.. ..$ percent: num [1:12] 0.0212 0.0214 0.0216 0.022 0.0219 ...
.. ..$ pce : num [1:12] 6977 6996 6988 7001 7047 ...
.. ..- attr(*, "terms")=Classes 'terms', 'formula' language percent ~ pce
.. .. .. ..- attr(*, "variables")= language list(percent, pce)
.. .. .. ..- attr(*, "factors")= int [1:2, 1] 0 1
.. .. .. .. ..- attr(*, "dimnames")=List of 2
.. .. .. .. .. ..$ : chr [1:2] "percent" "pce"
.. .. .. .. .. ..$ : chr "pce"
.. .. .. ..- attr(*, "term.labels")= chr "pce"
.. .. .. ..- attr(*, "order")= int 1
.. .. .. ..- attr(*, "intercept")= int 1
.. .. .. ..- attr(*, "response")= int 1
.. .. .. ..- attr(*, ".Environment")=<environment: 0x000002347db7b238>
.. .. .. ..- attr(*, "predvars")= language list(percent, pce)
.. .. .. ..- attr(*, "dataClasses")= Named chr [1:2] "numeric" "numeric"
.. .. .. .. ..- attr(*, "names")= chr [1:2] "percent" "pce"
..- attr(*, "class")= chr "lm"
$ 2002:List of 12
..$ coefficients : Named num [1:2] 1.43e-02 2.01e-06
.. ..- attr(*, "names")= chr [1:2] "(Intercept)" "pce"
..$ residuals : Named num [1:12] -2.10e-04 -2.04e-04 4.85e-05 9.17e-04 2.44e-04 ...
.. ..- attr(*, "names")= chr [1:12] "1" "2" "3" "4" ...
..$ effects : Named num [1:12] -0.100731 0.000692 0.00012 0.000964 0.000299 ...
.. ..- attr(*, "names")= chr [1:12] "(Intercept)" "pce" "" "" ...
..$ rank : int 2
..$ fitted.values: Named num [1:12] 0.0287 0.0288 0.0289 0.029 0.029 ...
.. ..- attr(*, "names")= chr [1:12] "1" "2" "3" "4" ...
..$ assign : int [1:2] 0 1
..$ qr :List of 5
.. ..$ qr : num [1:12, 1:2] -3.464 0.289 0.289 0.289 0.289 ...
.. .. ..- attr(*, "dimnames")=List of 2
.. .. .. ..$ : chr [1:12] "1" "2" "3" "4" ...
.. .. .. ..$ : chr [1:2] "(Intercept)" "pce"
.. .. ..- attr(*, "assign")= int [1:2] 0 1
.. ..$ qraux: num [1:2] 1.29 1.25
.. ..$ pivot: int [1:2] 1 2
.. ..$ tol : num 1e-07
.. ..$ rank : int 2
.. ..- attr(*, "class")= chr "qr"
..$ df.residual : int 10
..$ xlevels : Named list()
..$ call : language lm(formula = percent ~ pce, data = .x)
..$ terms :Classes 'terms', 'formula' language percent ~ pce
.. .. ..- attr(*, "variables")= language list(percent, pce)
.. .. ..- attr(*, "factors")= int [1:2, 1] 0 1
.. .. .. ..- attr(*, "dimnames")=List of 2
.. .. .. .. ..$ : chr [1:2] "percent" "pce"
.. .. .. .. ..$ : chr "pce"
.. .. ..- attr(*, "term.labels")= chr "pce"
.. .. ..- attr(*, "order")= int 1
.. .. ..- attr(*, "intercept")= int 1
.. .. ..- attr(*, "response")= int 1
.. .. ..- attr(*, ".Environment")=<environment: 0x000002347dc28430>
.. .. ..- attr(*, "predvars")= language list(percent, pce)
.. .. ..- attr(*, "dataClasses")= Named chr [1:2] "numeric" "numeric"
.. .. .. ..- attr(*, "names")= chr [1:2] "percent" "pce"
..$ model :'data.frame': 12 obs. of 2 variables:
.. ..$ percent: num [1:12] 0.0285 0.0286 0.0289 0.0299 0.0292 ...
.. ..$ pce : num [1:12] 7174 7218 7237 7305 7283 ...
.. ..- attr(*, "terms")=Classes 'terms', 'formula' language percent ~ pce
.. .. .. ..- attr(*, "variables")= language list(percent, pce)
.. .. .. ..- attr(*, "factors")= int [1:2, 1] 0 1
.. .. .. .. ..- attr(*, "dimnames")=List of 2
.. .. .. .. .. ..$ : chr [1:2] "percent" "pce"
.. .. .. .. .. ..$ : chr "pce"
.. .. .. ..- attr(*, "term.labels")= chr "pce"
.. .. .. ..- attr(*, "order")= int 1
.. .. .. ..- attr(*, "intercept")= int 1
.. .. .. ..- attr(*, "response")= int 1
.. .. .. ..- attr(*, ".Environment")=<environment: 0x000002347dc28430>
.. .. .. ..- attr(*, "predvars")= language list(percent, pce)
.. .. .. ..- attr(*, "dataClasses")= Named chr [1:2] "numeric" "numeric"
.. .. .. .. ..- attr(*, "names")= chr [1:2] "percent" "pce"
..- attr(*, "class")= chr "lm"
$ 2003:List of 12
..$ coefficients : Named num [1:2] 4.03e-02 -1.31e-06
.. ..- attr(*, "names")= chr [1:2] "(Intercept)" "pce"
..$ residuals : Named num [1:12] -0.000987 -0.000665 -0.000707 0.000176 0.000559 ...
.. ..- attr(*, "names")= chr [1:12] "1" "2" "3" "4" ...
..$ effects : Named num [1:12] -0.104501 -0.000616 -0.000427 0.00044 0.000817 ...
.. ..- attr(*, "names")= chr [1:12] "(Intercept)" "pce" "" "" ...
..$ rank : int 2
..$ fitted.values: Named num [1:12] 0.0304 0.0304 0.0303 0.0303 0.0303 ...
.. ..- attr(*, "names")= chr [1:12] "1" "2" "3" "4" ...
..$ assign : int [1:2] 0 1
..$ qr :List of 5
.. ..$ qr : num [1:12, 1:2] -3.464 0.289 0.289 0.289 0.289 ...
.. .. ..- attr(*, "dimnames")=List of 2
.. .. .. ..$ : chr [1:12] "1" "2" "3" "4" ...
.. .. .. ..$ : chr [1:2] "(Intercept)" "pce"
.. .. ..- attr(*, "assign")= int [1:2] 0 1
.. ..$ qraux: num [1:2] 1.29 1.31
.. ..$ pivot: int [1:2] 1 2
.. ..$ tol : num 1e-07
.. ..$ rank : int 2
.. ..- attr(*, "class")= chr "qr"
..$ df.residual : int 10
..$ xlevels : Named list()
..$ call : language lm(formula = percent ~ pce, data = .x)
..$ terms :Classes 'terms', 'formula' language percent ~ pce
.. .. ..- attr(*, "variables")= language list(percent, pce)
.. .. ..- attr(*, "factors")= int [1:2, 1] 0 1
.. .. .. ..- attr(*, "dimnames")=List of 2
.. .. .. .. ..$ : chr [1:2] "percent" "pce"
.. .. .. .. ..$ : chr "pce"
.. .. ..- attr(*, "term.labels")= chr "pce"
.. .. ..- attr(*, "order")= int 1
.. .. ..- attr(*, "intercept")= int 1
.. .. ..- attr(*, "response")= int 1
.. .. ..- attr(*, ".Environment")=<environment: 0x000002347dcb30e0>
.. .. ..- attr(*, "predvars")= language list(percent, pce)
.. .. ..- attr(*, "dataClasses")= Named chr [1:2] "numeric" "numeric"
.. .. .. ..- attr(*, "names")= chr [1:2] "percent" "pce"
..$ model :'data.frame': 12 obs. of 2 variables:
.. ..$ percent: num [1:12] 0.0294 0.0297 0.0296 0.0305 0.0308 ...
.. ..$ pce : num [1:12] 7533 7536 7598 7621 7628 ...
.. ..- attr(*, "terms")=Classes 'terms', 'formula' language percent ~ pce
.. .. .. ..- attr(*, "variables")= language list(percent, pce)
.. .. .. ..- attr(*, "factors")= int [1:2, 1] 0 1
.. .. .. .. ..- attr(*, "dimnames")=List of 2
.. .. .. .. .. ..$ : chr [1:2] "percent" "pce"
.. .. .. .. .. ..$ : chr "pce"
.. .. .. ..- attr(*, "term.labels")= chr "pce"
.. .. .. ..- attr(*, "order")= int 1
.. .. .. ..- attr(*, "intercept")= int 1
.. .. .. ..- attr(*, "response")= int 1
.. .. .. ..- attr(*, ".Environment")=<environment: 0x000002347dcb30e0>
.. .. .. ..- attr(*, "predvars")= language list(percent, pce)
.. .. .. ..- attr(*, "dataClasses")= Named chr [1:2] "numeric" "numeric"
.. .. .. .. ..- attr(*, "names")= chr [1:2] "percent" "pce"
..- attr(*, "class")= chr "lm"
$ 2004:List of 12
..$ coefficients : Named num [1:2] 5.76e-02 -3.64e-06
.. ..- attr(*, "names")= chr [1:2] "(Intercept)" "pce"
..$ residuals : Named num [1:12] 8.04e-05 -5.13e-04 7.80e-04 -2.92e-04 1.02e-04 ...
.. ..- attr(*, "names")= chr [1:12] "1" "2" "3" "4" ...
..$ effects : Named num [1:12] -9.61e-02 -1.94e-03 8.30e-04 -2.52e-04 8.35e-05 ...
.. ..- attr(*, "names")= chr [1:12] "(Intercept)" "pce" "" "" ...
..$ rank : int 2
..$ fitted.values: Named num [1:12] 0.0286 0.0284 0.0282 0.0282 0.0279 ...
.. ..- attr(*, "names")= chr [1:12] "1" "2" "3" "4" ...
..$ assign : int [1:2] 0 1
..$ qr :List of 5
.. ..$ qr : num [1:12, 1:2] -3.464 0.289 0.289 0.289 0.289 ...
.. .. ..- attr(*, "dimnames")=List of 2
.. .. .. ..$ : chr [1:12] "1" "2" "3" "4" ...
.. .. .. ..$ : chr [1:2] "(Intercept)" "pce"
.. .. ..- attr(*, "assign")= int [1:2] 0 1
.. ..$ qraux: num [1:2] 1.29 1.27
.. ..$ pivot: int [1:2] 1 2
.. ..$ tol : num 1e-07
.. ..$ rank : int 2
.. ..- attr(*, "class")= chr "qr"
..$ df.residual : int 10
..$ xlevels : Named list()
..$ call : language lm(formula = percent ~ pce, data = .x)
..$ terms :Classes 'terms', 'formula' language percent ~ pce
.. .. ..- attr(*, "variables")= language list(percent, pce)
.. .. ..- attr(*, "factors")= int [1:2, 1] 0 1
.. .. .. ..- attr(*, "dimnames")=List of 2
.. .. .. .. ..$ : chr [1:2] "percent" "pce"
.. .. .. .. ..$ : chr "pce"
.. .. ..- attr(*, "term.labels")= chr "pce"
.. .. ..- attr(*, "order")= int 1
.. .. ..- attr(*, "intercept")= int 1
.. .. ..- attr(*, "response")= int 1
.. .. ..- attr(*, ".Environment")=<environment: 0x000002347ddb0b68>
.. .. ..- attr(*, "predvars")= language list(percent, pce)
.. .. ..- attr(*, "dataClasses")= Named chr [1:2] "numeric" "numeric"
.. .. .. ..- attr(*, "names")= chr [1:2] "percent" "pce"
..$ model :'data.frame': 12 obs. of 2 variables:
.. ..$ percent: num [1:12] 0.0286 0.0279 0.029 0.0279 0.028 ...
.. ..$ pce : num [1:12] 7987 8020 8076 8089 8163 ...
.. ..- attr(*, "terms")=Classes 'terms', 'formula' language percent ~ pce
.. .. .. ..- attr(*, "variables")= language list(percent, pce)
.. .. .. ..- attr(*, "factors")= int [1:2, 1] 0 1
.. .. .. .. ..- attr(*, "dimnames")=List of 2
.. .. .. .. .. ..$ : chr [1:2] "percent" "pce"
.. .. .. .. .. ..$ : chr "pce"
.. .. .. ..- attr(*, "term.labels")= chr "pce"
.. .. .. ..- attr(*, "order")= int 1
.. .. .. ..- attr(*, "intercept")= int 1
.. .. .. ..- attr(*, "response")= int 1
.. .. .. ..- attr(*, ".Environment")=<environment: 0x000002347ddb0b68>
.. .. .. ..- attr(*, "predvars")= language list(percent, pce)
.. .. .. ..- attr(*, "dataClasses")= Named chr [1:2] "numeric" "numeric"
.. .. .. .. ..- attr(*, "names")= chr [1:2] "percent" "pce"
..- attr(*, "class")= chr "lm"
$ 2005:List of 12
..$ coefficients : Named num [1:2] 5.78e-02 -3.68e-06
.. ..- attr(*, "names")= chr [1:2] "(Intercept)" "pce"
..$ residuals : Named num [1:12] -2.22e-04 6.42e-04 -4.89e-05 -6.86e-06 -1.03e-04 ...
.. ..- attr(*, "names")= chr [1:12] "1" "2" "3" "4" ...
..$ effects : Named num [1:12] -8.87e-02 -2.11e-03 -1.09e-04 5.32e-06 -9.24e-05 ...
.. ..- attr(*, "names")= chr [1:12] "(Intercept)" "pce" "" "" ...
..$ rank : int 2
..$ fitted.values: Named num [1:12] 0.0266 0.0264 0.0263 0.026 0.026 ...
.. ..- attr(*, "names")= chr [1:12] "1" "2" "3" "4" ...
..$ assign : int [1:2] 0 1
..$ qr :List of 5
.. ..$ qr : num [1:12, 1:2] -3.464 0.289 0.289 0.289 0.289 ...
.. .. ..- attr(*, "dimnames")=List of 2
.. .. .. ..$ : chr [1:12] "1" "2" "3" "4" ...
.. .. .. ..$ : chr [1:2] "(Intercept)" "pce"
.. .. ..- attr(*, "assign")= int [1:2] 0 1
.. ..$ qraux: num [1:2] 1.29 1.27
.. ..$ pivot: int [1:2] 1 2
.. ..$ tol : num 1e-07
.. ..$ rank : int 2
.. ..- attr(*, "class")= chr "qr"
..$ df.residual : int 10
..$ xlevels : Named list()
..$ call : language lm(formula = percent ~ pce, data = .x)
..$ terms :Classes 'terms', 'formula' language percent ~ pce
.. .. ..- attr(*, "variables")= language list(percent, pce)
.. .. ..- attr(*, "factors")= int [1:2, 1] 0 1
.. .. .. ..- attr(*, "dimnames")=List of 2
.. .. .. .. ..$ : chr [1:2] "percent" "pce"
.. .. .. .. ..$ : chr "pce"
.. .. ..- attr(*, "term.labels")= chr "pce"
.. .. ..- attr(*, "order")= int 1
.. .. ..- attr(*, "intercept")= int 1
.. .. ..- attr(*, "response")= int 1
.. .. ..- attr(*, ".Environment")=<environment: 0x000002347deade00>
.. .. ..- attr(*, "predvars")= language list(percent, pce)
.. .. ..- attr(*, "dataClasses")= Named chr [1:2] "numeric" "numeric"
.. .. .. ..- attr(*, "names")= chr [1:2] "percent" "pce"
..$ model :'data.frame': 12 obs. of 2 variables:
.. ..$ percent: num [1:12] 0.0264 0.027 0.0262 0.026 0.0259 ...
.. ..$ pce : num [1:12] 8470 8529 8570 8646 8644 ...
.. ..- attr(*, "terms")=Classes 'terms', 'formula' language percent ~ pce
.. .. .. ..- attr(*, "variables")= language list(percent, pce)
.. .. .. ..- attr(*, "factors")= int [1:2, 1] 0 1
.. .. .. .. ..- attr(*, "dimnames")=List of 2
.. .. .. .. .. ..$ : chr [1:2] "percent" "pce"
.. .. .. .. .. ..$ : chr "pce"
.. .. .. ..- attr(*, "term.labels")= chr "pce"
.. .. .. ..- attr(*, "order")= int 1
.. .. .. ..- attr(*, "intercept")= int 1
.. .. .. ..- attr(*, "response")= int 1
.. .. .. ..- attr(*, ".Environment")=<environment: 0x000002347deade00>
.. .. .. ..- attr(*, "predvars")= language list(percent, pce)
.. .. .. ..- attr(*, "dataClasses")= Named chr [1:2] "numeric" "numeric"
.. .. .. .. ..- attr(*, "names")= chr [1:2] "percent" "pce"
..- attr(*, "class")= chr "lm"
$ 2006:List of 12
..$ coefficients : Named num [1:2] 5.46e-02 -3.37e-06
.. ..- attr(*, "names")= chr [1:2] "(Intercept)" "pce"
..$ residuals : Named num [1:12] -0.000332 0.000157 -0.000128 0.000193 -0.000157 ...
.. ..- attr(*, "names")= chr [1:12] "1" "2" "3" "4" ...
..$ effects : Named num [1:12] -8.10e-02 -1.45e-03 -9.23e-05 2.50e-04 -8.33e-05 ...
.. ..- attr(*, "names")= chr [1:12] "(Intercept)" "pce" "" "" ...
..$ rank : int 2
..$ fitted.values: Named num [1:12] 0.0241 0.024 0.0239 0.0237 0.0235 ...
.. ..- attr(*, "names")= chr [1:12] "1" "2" "3" "4" ...
..$ assign : int [1:2] 0 1
..$ qr :List of 5
.. ..$ qr : num [1:12, 1:2] -3.464 0.289 0.289 0.289 0.289 ...
.. .. ..- attr(*, "dimnames")=List of 2
.. .. .. ..$ : chr [1:12] "1" "2" "3" "4" ...
.. .. .. ..$ : chr [1:2] "(Intercept)" "pce"
.. .. ..- attr(*, "assign")= int [1:2] 0 1
.. ..$ qraux: num [1:2] 1.29 1.29
.. ..$ pivot: int [1:2] 1 2
.. ..$ tol : num 1e-07
.. ..$ rank : int 2
.. ..- attr(*, "class")= chr "qr"
..$ df.residual : int 10
..$ xlevels : Named list()
..$ call : language lm(formula = percent ~ pce, data = .x)
..$ terms :Classes 'terms', 'formula' language percent ~ pce
.. .. ..- attr(*, "variables")= language list(percent, pce)
.. .. ..- attr(*, "factors")= int [1:2, 1] 0 1
.. .. .. ..- attr(*, "dimnames")=List of 2
.. .. .. .. ..$ : chr [1:2] "percent" "pce"
.. .. .. .. ..$ : chr "pce"
.. .. ..- attr(*, "term.labels")= chr "pce"
.. .. ..- attr(*, "order")= int 1
.. .. ..- attr(*, "intercept")= int 1
.. .. ..- attr(*, "response")= int 1
.. .. ..- attr(*, ".Environment")=<environment: 0x000002347dfb8740>
.. .. ..- attr(*, "predvars")= language list(percent, pce)
.. .. ..- attr(*, "dataClasses")= Named chr [1:2] "numeric" "numeric"
.. .. .. ..- attr(*, "names")= chr [1:2] "percent" "pce"
..$ model :'data.frame': 12 obs. of 2 variables:
.. ..$ percent: num [1:12] 0.0237 0.0241 0.0237 0.0239 0.0234 ...
.. ..$ pce : num [1:12] 9060 9090 9122 9175 9215 ...
.. ..- attr(*, "terms")=Classes 'terms', 'formula' language percent ~ pce
.. .. .. ..- attr(*, "variables")= language list(percent, pce)
.. .. .. ..- attr(*, "factors")= int [1:2, 1] 0 1
.. .. .. .. ..- attr(*, "dimnames")=List of 2
.. .. .. .. .. ..$ : chr [1:2] "percent" "pce"
.. .. .. .. .. ..$ : chr "pce"
.. .. .. ..- attr(*, "term.labels")= chr "pce"
.. .. .. ..- attr(*, "order")= int 1
.. .. .. ..- attr(*, "intercept")= int 1
.. .. .. ..- attr(*, "response")= int 1
.. .. .. ..- attr(*, ".Environment")=<environment: 0x000002347dfb8740>
.. .. .. ..- attr(*, "predvars")= language list(percent, pce)
.. .. .. ..- attr(*, "dataClasses")= Named chr [1:2] "numeric" "numeric"
.. .. .. .. ..- attr(*, "names")= chr [1:2] "percent" "pce"
..- attr(*, "class")= chr "lm"
$ 2007:List of 12
..$ coefficients : Named num [1:2] -1.72e-02 4.19e-06
.. ..- attr(*, "names")= chr [1:2] "(Intercept)" "pce"
..$ residuals : Named num [1:12] 0.001044 0.00027 -0.000558 -0.000309 -0.000754 ...
.. ..- attr(*, "names")= chr [1:12] "1" "2" "3" "4" ...
..$ effects : Named num [1:12] -0.081153 0.001834 -0.000797 -0.000546 -0.000988 ...
.. ..- attr(*, "names")= chr [1:12] "(Intercept)" "pce" "" "" ...
..$ rank : int 2
..$ fitted.values: Named num [1:12] 0.0226 0.0228 0.0229 0.023 0.0232 ...
.. ..- attr(*, "names")= chr [1:12] "1" "2" "3" "4" ...
..$ assign : int [1:2] 0 1
..$ qr :List of 5
.. ..$ qr : num [1:12, 1:2] -3.464 0.289 0.289 0.289 0.289 ...
.. .. ..- attr(*, "dimnames")=List of 2
.. .. .. ..$ : chr [1:12] "1" "2" "3" "4" ...
.. .. .. ..$ : chr [1:2] "(Intercept)" "pce"
.. .. ..- attr(*, "assign")= int [1:2] 0 1
.. ..$ qraux: num [1:2] 1.29 1.27
.. ..$ pivot: int [1:2] 1 2
.. ..$ tol : num 1e-07
.. ..$ rank : int 2
.. ..- attr(*, "class")= chr "qr"
..$ df.residual : int 10
..$ xlevels : Named list()
..$ call : language lm(formula = percent ~ pce, data = .x)
..$ terms :Classes 'terms', 'formula' language percent ~ pce
.. .. ..- attr(*, "variables")= language list(percent, pce)
.. .. ..- attr(*, "factors")= int [1:2, 1] 0 1
.. .. .. ..- attr(*, "dimnames")=List of 2
.. .. .. .. ..$ : chr [1:2] "percent" "pce"
.. .. .. .. ..$ : chr "pce"
.. .. ..- attr(*, "term.labels")= chr "pce"
.. .. ..- attr(*, "order")= int 1
.. .. ..- attr(*, "intercept")= int 1
.. .. ..- attr(*, "response")= int 1
.. .. ..- attr(*, ".Environment")=<environment: 0x000002347e07d900>
.. .. ..- attr(*, "predvars")= language list(percent, pce)
.. .. ..- attr(*, "dataClasses")= Named chr [1:2] "numeric" "numeric"
.. .. .. ..- attr(*, "names")= chr [1:2] "percent" "pce"
..$ model :'data.frame': 12 obs. of 2 variables:
.. ..$ percent: num [1:12] 0.0237 0.023 0.0224 0.0227 0.0224 ...
.. ..$ pce : num [1:12] 9516 9547 9585 9616 9651 ...
.. ..- attr(*, "terms")=Classes 'terms', 'formula' language percent ~ pce
.. .. .. ..- attr(*, "variables")= language list(percent, pce)
.. .. .. ..- attr(*, "factors")= int [1:2, 1] 0 1
.. .. .. .. ..- attr(*, "dimnames")=List of 2
.. .. .. .. .. ..$ : chr [1:2] "percent" "pce"
.. .. .. .. .. ..$ : chr "pce"
.. .. .. ..- attr(*, "term.labels")= chr "pce"
.. .. .. ..- attr(*, "order")= int 1
.. .. .. ..- attr(*, "intercept")= int 1
.. .. .. ..- attr(*, "response")= int 1
.. .. .. ..- attr(*, ".Environment")=<environment: 0x000002347e07d900>
.. .. .. ..- attr(*, "predvars")= language list(percent, pce)
.. .. .. ..- attr(*, "dataClasses")= Named chr [1:2] "numeric" "numeric"
.. .. .. .. ..- attr(*, "names")= chr [1:2] "percent" "pce"
..- attr(*, "class")= chr "lm"
$ 2008:List of 12
..$ coefficients : Named num [1:2] 1.78e-01 -1.49e-05
.. ..- attr(*, "names")= chr [1:2] "(Intercept)" "pce"
..$ residuals : Named num [1:12] -0.004727 -0.005612 -0.003871 -0.003938 -0.000612 ...
.. ..- attr(*, "names")= chr [1:12] "1" "2" "3" "4" ...
..$ effects : Named num [1:12] -0.101691 -0.005787 -0.002744 -0.003198 -0.000463 ...
.. ..- attr(*, "names")= chr [1:12] "(Intercept)" "pce" "" "" ...
..$ rank : int 2
..$ fitted.values: Named num [1:12] 0.03 0.0303 0.0296 0.029 0.0282 ...
.. ..- attr(*, "names")= chr [1:12] "1" "2" "3" "4" ...
..$ assign : int [1:2] 0 1
..$ qr :List of 5
.. ..$ qr : num [1:12, 1:2] -3.464 0.289 0.289 0.289 0.289 ...
.. .. ..- attr(*, "dimnames")=List of 2
.. .. .. ..$ : chr [1:12] "1" "2" "3" "4" ...
.. .. .. ..$ : chr [1:2] "(Intercept)" "pce"
.. .. ..- attr(*, "assign")= int [1:2] 0 1
.. ..$ qraux: num [1:2] 1.29 1.14
.. ..$ pivot: int [1:2] 1 2
.. ..$ tol : num 1e-07
.. ..$ rank : int 2
.. ..- attr(*, "class")= chr "qr"
..$ df.residual : int 10
..$ xlevels : Named list()
..$ call : language lm(formula = percent ~ pce, data = .x)
..$ terms :Classes 'terms', 'formula' language percent ~ pce
.. .. ..- attr(*, "variables")= language list(percent, pce)
.. .. ..- attr(*, "factors")= int [1:2, 1] 0 1
.. .. .. ..- attr(*, "dimnames")=List of 2
.. .. .. .. ..$ : chr [1:2] "percent" "pce"
.. .. .. .. ..$ : chr "pce"
.. .. ..- attr(*, "term.labels")= chr "pce"
.. .. ..- attr(*, "order")= int 1
.. .. ..- attr(*, "intercept")= int 1
.. .. ..- attr(*, "response")= int 1
.. .. ..- attr(*, ".Environment")=<environment: 0x000002347e199b60>
.. .. ..- attr(*, "predvars")= language list(percent, pce)
.. .. ..- attr(*, "dataClasses")= Named chr [1:2] "numeric" "numeric"
.. .. .. ..- attr(*, "names")= chr [1:2] "percent" "pce"
..$ model :'data.frame': 12 obs. of 2 variables:
.. ..$ percent: num [1:12] 0.0253 0.0247 0.0257 0.0251 0.0276 ...
.. ..$ pce : num [1:12] 9930 9913 9959 9997 10054 ...
.. ..- attr(*, "terms")=Classes 'terms', 'formula' language percent ~ pce
.. .. .. ..- attr(*, "variables")= language list(percent, pce)
.. .. .. ..- attr(*, "factors")= int [1:2, 1] 0 1
.. .. .. .. ..- attr(*, "dimnames")=List of 2
.. .. .. .. .. ..$ : chr [1:2] "percent" "pce"
.. .. .. .. .. ..$ : chr "pce"
.. .. .. ..- attr(*, "term.labels")= chr "pce"
.. .. .. ..- attr(*, "order")= int 1
.. .. .. ..- attr(*, "intercept")= int 1
.. .. .. ..- attr(*, "response")= int 1
.. .. .. ..- attr(*, ".Environment")=<environment: 0x000002347e199b60>
.. .. .. ..- attr(*, "predvars")= language list(percent, pce)
.. .. .. ..- attr(*, "dataClasses")= Named chr [1:2] "numeric" "numeric"
.. .. .. .. ..- attr(*, "names")= chr [1:2] "percent" "pce"
..- attr(*, "class")= chr "lm"
$ 2009:List of 12
..$ coefficients : Named num [1:2] -1.73e-01 2.23e-05
.. ..- attr(*, "names")= chr [1:2] "(Intercept)" "pce"
..$ residuals : Named num [1:12] -5.82e-03 -2.70e-03 5.17e-05 1.27e-03 2.81e-03 ...
.. ..- attr(*, "names")= chr [1:12] "1" "2" "3" "4" ...
..$ effects : Named num [1:12] -0.16107 0.00727 0.00175 0.00295 0.0044 ...
.. ..- attr(*, "names")= chr [1:12] "(Intercept)" "pce" "" "" ...
..$ rank : int 2
..$ fitted.values: Named num [1:12] 0.0452 0.0448 0.0437 0.0439 0.0444 ...
.. ..- attr(*, "names")= chr [1:12] "1" "2" "3" "4" ...
..$ assign : int [1:2] 0 1
..$ qr :List of 5
.. ..$ qr : num [1:12, 1:2] -3.464 0.289 0.289 0.289 0.289 ...
.. .. ..- attr(*, "dimnames")=List of 2
.. .. .. ..$ : chr [1:12] "1" "2" "3" "4" ...
.. .. .. ..$ : chr [1:2] "(Intercept)" "pce"
.. .. ..- attr(*, "assign")= int [1:2] 0 1
.. ..$ qraux: num [1:2] 1.29 1.19
.. ..$ pivot: int [1:2] 1 2
.. ..$ tol : num 1e-07
.. ..$ rank : int 2
.. ..- attr(*, "class")= chr "qr"
..$ df.residual : int 10
..$ xlevels : Named list()
..$ call : language lm(formula = percent ~ pce, data = .x)
..$ terms :Classes 'terms', 'formula' language percent ~ pce
.. .. ..- attr(*, "variables")= language list(percent, pce)
.. .. ..- attr(*, "factors")= int [1:2, 1] 0 1
.. .. .. ..- attr(*, "dimnames")=List of 2
.. .. .. .. ..$ : chr [1:2] "percent" "pce"
.. .. .. .. ..$ : chr "pce"
.. .. ..- attr(*, "term.labels")= chr "pce"
.. .. ..- attr(*, "order")= int 1
.. .. ..- attr(*, "intercept")= int 1
.. .. ..- attr(*, "response")= int 1
.. .. ..- attr(*, ".Environment")=<environment: 0x000002347e3211c0>
.. .. ..- attr(*, "predvars")= language list(percent, pce)
.. .. ..- attr(*, "dataClasses")= Named chr [1:2] "numeric" "numeric"
.. .. .. ..- attr(*, "names")= chr [1:2] "percent" "pce"
..$ model :'data.frame': 12 obs. of 2 variables:
.. ..$ percent: num [1:12] 0.0394 0.0421 0.0438 0.0452 0.0472 ...
.. ..$ pce : num [1:12] 9784 9766 9718 9725 9749 ...
.. ..- attr(*, "terms")=Classes 'terms', 'formula' language percent ~ pce
.. .. .. ..- attr(*, "variables")= language list(percent, pce)
.. .. .. ..- attr(*, "factors")= int [1:2, 1] 0 1
.. .. .. .. ..- attr(*, "dimnames")=List of 2
.. .. .. .. .. ..$ : chr [1:2] "percent" "pce"
.. .. .. .. .. ..$ : chr "pce"
.. .. .. ..- attr(*, "term.labels")= chr "pce"
.. .. .. ..- attr(*, "order")= int 1
.. .. .. ..- attr(*, "intercept")= int 1
.. .. .. ..- attr(*, "response")= int 1
.. .. .. ..- attr(*, ".Environment")=<environment: 0x000002347e3211c0>
.. .. .. ..- attr(*, "predvars")= language list(percent, pce)
.. .. .. ..- attr(*, "dataClasses")= Named chr [1:2] "numeric" "numeric"
.. .. .. .. ..- attr(*, "names")= chr [1:2] "percent" "pce"
..- attr(*, "class")= chr "lm"
$ 2010:List of 12
..$ coefficients : Named num [1:2] 1.07e-01 -5.84e-06
.. ..- attr(*, "names")= chr [1:2] "(Intercept)" "pce"
..$ residuals : Named num [1:12] -0.000166 0.000189 0.000789 0.001329 -0.000132 ...
.. ..- attr(*, "names")= chr [1:12] "1" "2" "3" "4" ...
..$ effects : Named num [1:12] -0.165615 -0.002394 0.000802 0.001353 -0.000101 ...
.. ..- attr(*, "names")= chr [1:12] "(Intercept)" "pce" "" "" ...
..$ rank : int 2
..$ fitted.values: Named num [1:12] 0.0489 0.0487 0.0484 0.0482 0.0481 ...
.. ..- attr(*, "names")= chr [1:12] "1" "2" "3" "4" ...
..$ assign : int [1:2] 0 1
..$ qr :List of 5
.. ..$ qr : num [1:12, 1:2] -3.464 0.289 0.289 0.289 0.289 ...
.. .. ..- attr(*, "dimnames")=List of 2
.. .. .. ..$ : chr [1:12] "1" "2" "3" "4" ...
.. .. .. ..$ : chr [1:2] "(Intercept)" "pce"
.. .. ..- attr(*, "assign")= int [1:2] 0 1
.. ..$ qraux: num [1:2] 1.29 1.28
.. ..$ pivot: int [1:2] 1 2
.. ..$ tol : num 1e-07
.. ..$ rank : int 2
.. ..- attr(*, "class")= chr "qr"
..$ df.residual : int 10
..$ xlevels : Named list()
..$ call : language lm(formula = percent ~ pce, data = .x)
..$ terms :Classes 'terms', 'formula' language percent ~ pce
.. .. ..- attr(*, "variables")= language list(percent, pce)
.. .. ..- attr(*, "factors")= int [1:2, 1] 0 1
.. .. .. ..- attr(*, "dimnames")=List of 2
.. .. .. .. ..$ : chr [1:2] "percent" "pce"
.. .. .. .. ..$ : chr "pce"
.. .. ..- attr(*, "term.labels")= chr "pce"
.. .. ..- attr(*, "order")= int 1
.. .. ..- attr(*, "intercept")= int 1
.. .. ..- attr(*, "response")= int 1
.. .. ..- attr(*, ".Environment")=<environment: 0x000002347e3b9c08>
.. .. ..- attr(*, "predvars")= language list(percent, pce)
.. .. ..- attr(*, "dataClasses")= Named chr [1:2] "numeric" "numeric"
.. .. .. ..- attr(*, "names")= chr [1:2] "percent" "pce"
..$ model :'data.frame': 12 obs. of 2 variables:
.. ..$ percent: num [1:12] 0.0487 0.0489 0.0492 0.0496 0.048 ...
.. ..$ pce : num [1:12] 10002 10031 10089 10113 10131 ...
.. ..- attr(*, "terms")=Classes 'terms', 'formula' language percent ~ pce
.. .. .. ..- attr(*, "variables")= language list(percent, pce)
.. .. .. ..- attr(*, "factors")= int [1:2, 1] 0 1
.. .. .. .. ..- attr(*, "dimnames")=List of 2
.. .. .. .. .. ..$ : chr [1:2] "percent" "pce"
.. .. .. .. .. ..$ : chr "pce"
.. .. .. ..- attr(*, "term.labels")= chr "pce"
.. .. .. ..- attr(*, "order")= int 1
.. .. .. ..- attr(*, "intercept")= int 1
.. .. .. ..- attr(*, "response")= int 1
.. .. .. ..- attr(*, ".Environment")=<environment: 0x000002347e3b9c08>
.. .. .. ..- attr(*, "predvars")= language list(percent, pce)
.. .. .. ..- attr(*, "dataClasses")= Named chr [1:2] "numeric" "numeric"
.. .. .. .. ..- attr(*, "names")= chr [1:2] "percent" "pce"
..- attr(*, "class")= chr "lm"
$ 2011:List of 12
..$ coefficients : Named num [1:2] 1.04e-01 -5.65e-06
.. ..- attr(*, "names")= chr [1:2] "(Intercept)" "pce"
..$ residuals : Named num [1:12] -0.000141 -0.000588 -0.000423 0.000469 0.000255 ...
.. ..- attr(*, "names")= chr [1:12] "1" "2" "3" "4" ...
..$ effects : Named num [1:12] -0.152571 -0.002124 -0.000341 0.000509 0.000268 ...
.. ..- attr(*, "names")= chr [1:12] "(Intercept)" "pce" "" "" ...
..$ rank : int 2
..$ fitted.values: Named num [1:12] 0.0452 0.045 0.0446 0.0443 0.0442 ...
.. ..- attr(*, "names")= chr [1:12] "1" "2" "3" "4" ...
..$ assign : int [1:2] 0 1
..$ qr :List of 5
.. ..$ qr : num [1:12, 1:2] -3.464 0.289 0.289 0.289 0.289 ...
.. .. ..- attr(*, "dimnames")=List of 2
.. .. .. ..$ : chr [1:12] "1" "2" "3" "4" ...
.. .. .. ..$ : chr [1:2] "(Intercept)" "pce"
.. .. ..- attr(*, "assign")= int [1:2] 0 1
.. ..$ qraux: num [1:2] 1.29 1.33
.. ..$ pivot: int [1:2] 1 2
.. ..$ tol : num 1e-07
.. ..$ rank : int 2
.. ..- attr(*, "class")= chr "qr"
..$ df.residual : int 10
..$ xlevels : Named list()
..$ call : language lm(formula = percent ~ pce, data = .x)
..$ terms :Classes 'terms', 'formula' language percent ~ pce
.. .. ..- attr(*, "variables")= language list(percent, pce)
.. .. ..- attr(*, "factors")= int [1:2, 1] 0 1
.. .. .. ..- attr(*, "dimnames")=List of 2
.. .. .. .. ..$ : chr [1:2] "percent" "pce"
.. .. .. .. ..$ : chr "pce"
.. .. ..- attr(*, "term.labels")= chr "pce"
.. .. ..- attr(*, "order")= int 1
.. .. ..- attr(*, "intercept")= int 1
.. .. ..- attr(*, "response")= int 1
.. .. ..- attr(*, ".Environment")=<environment: 0x000002347e527888>
.. .. ..- attr(*, "predvars")= language list(percent, pce)
.. .. ..- attr(*, "dataClasses")= Named chr [1:2] "numeric" "numeric"
.. .. .. ..- attr(*, "names")= chr [1:2] "percent" "pce"
..$ model :'data.frame': 12 obs. of 2 variables:
.. ..$ percent: num [1:12] 0.0451 0.0444 0.0441 0.0448 0.0445 ...
.. ..$ pce : num [1:12] 10436 10470 10550 10588 10612 ...
.. ..- attr(*, "terms")=Classes 'terms', 'formula' language percent ~ pce
.. .. .. ..- attr(*, "variables")= language list(percent, pce)
.. .. .. ..- attr(*, "factors")= int [1:2, 1] 0 1
.. .. .. .. ..- attr(*, "dimnames")=List of 2
.. .. .. .. .. ..$ : chr [1:2] "percent" "pce"
.. .. .. .. .. ..$ : chr "pce"
.. .. .. ..- attr(*, "term.labels")= chr "pce"
.. .. .. ..- attr(*, "order")= int 1
.. .. .. ..- attr(*, "intercept")= int 1
.. .. .. ..- attr(*, "response")= int 1
.. .. .. ..- attr(*, ".Environment")=<environment: 0x000002347e527888>
.. .. .. ..- attr(*, "predvars")= language list(percent, pce)
.. .. .. ..- attr(*, "dataClasses")= Named chr [1:2] "numeric" "numeric"
.. .. .. .. ..- attr(*, "names")= chr [1:2] "percent" "pce"
..- attr(*, "class")= chr "lm"
$ 2012:List of 12
..$ coefficients : Named num [1:2] 1.58e-01 -1.07e-05
.. ..- attr(*, "names")= chr [1:2] "(Intercept)" "pce"
..$ residuals : Named num [1:12] -0.000475 0.000534 0.000176 0.000239 0.000144 ...
.. ..- attr(*, "names")= chr [1:12] "1" "2" "3" "4" ...
..$ effects : Named num [1:12] -0.137828 -0.003027 0.000234 0.000357 0.000238 ...
.. ..- attr(*, "names")= chr [1:12] "(Intercept)" "pce" "" "" ...
..$ rank : int 2
..$ fitted.values: Named num [1:12] 0.0413 0.0404 0.0404 0.0401 0.0402 ...
.. ..- attr(*, "names")= chr [1:12] "1" "2" "3" "4" ...
..$ assign : int [1:2] 0 1
..$ qr :List of 5
.. ..$ qr : num [1:12, 1:2] -3.464 0.289 0.289 0.289 0.289 ...
.. .. ..- attr(*, "dimnames")=List of 2
.. .. .. ..$ : chr [1:12] "1" "2" "3" "4" ...
.. .. .. ..$ : chr [1:2] "(Intercept)" "pce"
.. .. ..- attr(*, "assign")= int [1:2] 0 1
.. ..$ qraux: num [1:2] 1.29 1.07
.. ..$ pivot: int [1:2] 1 2
.. ..$ tol : num 1e-07
.. ..$ rank : int 2
.. ..- attr(*, "class")= chr "qr"
..$ df.residual : int 10
..$ xlevels : Named list()
..$ call : language lm(formula = percent ~ pce, data = .x)
..$ terms :Classes 'terms', 'formula' language percent ~ pce
.. .. ..- attr(*, "variables")= language list(percent, pce)
.. .. ..- attr(*, "factors")= int [1:2, 1] 0 1
.. .. .. ..- attr(*, "dimnames")=List of 2
.. .. .. .. ..$ : chr [1:2] "percent" "pce"
.. .. .. .. ..$ : chr "pce"
.. .. ..- attr(*, "term.labels")= chr "pce"
.. .. ..- attr(*, "order")= int 1
.. .. ..- attr(*, "intercept")= int 1
.. .. ..- attr(*, "response")= int 1
.. .. ..- attr(*, ".Environment")=<environment: 0x000002347e6083c0>
.. .. ..- attr(*, "predvars")= language list(percent, pce)
.. .. ..- attr(*, "dataClasses")= Named chr [1:2] "numeric" "numeric"
.. .. .. ..- attr(*, "names")= chr [1:2] "percent" "pce"
..$ model :'data.frame': 12 obs. of 2 variables:
.. ..$ percent: num [1:12] 0.0409 0.0409 0.0406 0.0403 0.0403 ...
.. ..$ pce : num [1:12] 10862 10954 10952 10980 10969 ...
.. ..- attr(*, "terms")=Classes 'terms', 'formula' language percent ~ pce
.. .. .. ..- attr(*, "variables")= language list(percent, pce)
.. .. .. ..- attr(*, "factors")= int [1:2, 1] 0 1
.. .. .. .. ..- attr(*, "dimnames")=List of 2
.. .. .. .. .. ..$ : chr [1:2] "percent" "pce"
.. .. .. .. .. ..$ : chr "pce"
.. .. .. ..- attr(*, "term.labels")= chr "pce"
.. .. .. ..- attr(*, "order")= int 1
.. .. .. ..- attr(*, "intercept")= int 1
.. .. .. ..- attr(*, "response")= int 1
.. .. .. ..- attr(*, ".Environment")=<environment: 0x000002347e6083c0>
.. .. .. ..- attr(*, "predvars")= language list(percent, pce)
.. .. .. ..- attr(*, "dataClasses")= Named chr [1:2] "numeric" "numeric"
.. .. .. .. ..- attr(*, "names")= chr [1:2] "percent" "pce"
..- attr(*, "class")= chr "lm"
$ 2013:List of 12
..$ coefficients : Named num [1:2] 2.10e-01 -1.54e-05
.. ..- attr(*, "names")= chr [1:2] "(Intercept)" "pce"
..$ residuals : Named num [1:12] 0.001561 0.000459 -0.000577 -0.000704 -0.000456 ...
.. ..- attr(*, "names")= chr [1:12] "1" "2" "3" "4" ...
..$ effects : Named num [1:12] -0.125478 -0.005544 -0.000944 -0.001076 -0.000819 ...
.. ..- attr(*, "names")= chr [1:12] "(Intercept)" "pce" "" "" ...
..$ rank : int 2
..$ fitted.values: Named num [1:12] 0.038 0.0374 0.0376 0.0379 0.0373 ...
.. ..- attr(*, "names")= chr [1:12] "1" "2" "3" "4" ...
..$ assign : int [1:2] 0 1
..$ qr :List of 5
.. ..$ qr : num [1:12, 1:2] -3.464 0.289 0.289 0.289 0.289 ...
.. .. ..- attr(*, "dimnames")=List of 2
.. .. .. ..$ : chr [1:12] "1" "2" "3" "4" ...
.. .. .. ..$ : chr [1:2] "(Intercept)" "pce"
.. .. ..- attr(*, "assign")= int [1:2] 0 1
.. ..$ qraux: num [1:2] 1.29 1.14
.. ..$ pivot: int [1:2] 1 2
.. ..$ tol : num 1e-07
.. ..$ rank : int 2
.. ..- attr(*, "class")= chr "qr"
..$ df.residual : int 10
..$ xlevels : Named list()
..$ call : language lm(formula = percent ~ pce, data = .x)
..$ terms :Classes 'terms', 'formula' language percent ~ pce
.. .. ..- attr(*, "variables")= language list(percent, pce)
.. .. ..- attr(*, "factors")= int [1:2, 1] 0 1
.. .. .. ..- attr(*, "dimnames")=List of 2
.. .. .. .. ..$ : chr [1:2] "percent" "pce"
.. .. .. .. ..$ : chr "pce"
.. .. ..- attr(*, "term.labels")= chr "pce"
.. .. ..- attr(*, "order")= int 1
.. .. ..- attr(*, "intercept")= int 1
.. .. ..- attr(*, "response")= int 1
.. .. ..- attr(*, ".Environment")=<environment: 0x000002347e694970>
.. .. ..- attr(*, "predvars")= language list(percent, pce)
.. .. ..- attr(*, "dataClasses")= Named chr [1:2] "numeric" "numeric"
.. .. .. ..- attr(*, "names")= chr [1:2] "percent" "pce"
..$ model :'data.frame': 12 obs. of 2 variables:
.. ..$ percent: num [1:12] 0.0395 0.0379 0.037 0.0372 0.0369 ...
.. ..$ pce : num [1:12] 11203 11240 11227 11205 11245 ...
.. ..- attr(*, "terms")=Classes 'terms', 'formula' language percent ~ pce
.. .. .. ..- attr(*, "variables")= language list(percent, pce)
.. .. .. ..- attr(*, "factors")= int [1:2, 1] 0 1
.. .. .. .. ..- attr(*, "dimnames")=List of 2
.. .. .. .. .. ..$ : chr [1:2] "percent" "pce"
.. .. .. .. .. ..$ : chr "pce"
.. .. .. ..- attr(*, "term.labels")= chr "pce"
.. .. .. ..- attr(*, "order")= int 1
.. .. .. ..- attr(*, "intercept")= int 1
.. .. .. ..- attr(*, "response")= int 1
.. .. .. ..- attr(*, ".Environment")=<environment: 0x000002347e694970>
.. .. .. ..- attr(*, "predvars")= language list(percent, pce)
.. .. .. ..- attr(*, "dataClasses")= Named chr [1:2] "numeric" "numeric"
.. .. .. .. ..- attr(*, "names")= chr [1:2] "percent" "pce"
..- attr(*, "class")= chr "lm"
$ 2014:List of 12
..$ coefficients : Named num [1:2] 1.32e-01 -8.59e-06
.. ..- attr(*, "names")= chr [1:2] "(Intercept)" "pce"
..$ residuals : Named num [1:12] -0.000692 0.000216 0.000957 -0.00068 0.000189 ...
.. ..- attr(*, "names")= chr [1:12] "1" "2" "3" "4" ...
..$ effects : Named num [1:12] -0.104402 -0.005422 0.001061 -0.000549 0.000341 ...
.. ..- attr(*, "names")= chr [1:12] "(Intercept)" "pce" "" "" ...
..$ rank : int 2
..$ fitted.values: Named num [1:12] 0.0328 0.0324 0.0317 0.0312 0.0308 ...
.. ..- attr(*, "names")= chr [1:12] "1" "2" "3" "4" ...
..$ assign : int [1:2] 0 1
..$ qr :List of 5
.. ..$ qr : num [1:12, 1:2] -3.464 0.289 0.289 0.289 0.289 ...
.. .. ..- attr(*, "dimnames")=List of 2
.. .. .. ..$ : chr [1:12] "1" "2" "3" "4" ...
.. .. .. ..$ : chr [1:2] "(Intercept)" "pce"
.. .. ..- attr(*, "assign")= int [1:2] 0 1
.. ..$ qraux: num [1:2] 1.29 1.3
.. ..$ pivot: int [1:2] 1 2
.. ..$ tol : num 1e-07
.. ..$ rank : int 2
.. ..- attr(*, "class")= chr "qr"
..$ df.residual : int 10
..$ xlevels : Named list()
..$ call : language lm(formula = percent ~ pce, data = .x)
..$ terms :Classes 'terms', 'formula' language percent ~ pce
.. .. ..- attr(*, "variables")= language list(percent, pce)
.. .. ..- attr(*, "factors")= int [1:2, 1] 0 1
.. .. .. ..- attr(*, "dimnames")=List of 2
.. .. .. .. ..$ : chr [1:2] "percent" "pce"
.. .. .. .. ..$ : chr "pce"
.. .. ..- attr(*, "term.labels")= chr "pce"
.. .. ..- attr(*, "order")= int 1
.. .. ..- attr(*, "intercept")= int 1
.. .. ..- attr(*, "response")= int 1
.. .. ..- attr(*, ".Environment")=<environment: 0x000002347e74a7e0>
.. .. ..- attr(*, "predvars")= language list(percent, pce)
.. .. ..- attr(*, "dataClasses")= Named chr [1:2] "numeric" "numeric"
.. .. .. ..- attr(*, "names")= chr [1:2] "percent" "pce"
..$ model :'data.frame': 12 obs. of 2 variables:
.. ..$ percent: num [1:12] 0.0321 0.0326 0.0327 0.0305 0.031 ...
.. ..$ pce : num [1:12] 11512 11566 11643 11703 11748 ...
.. ..- attr(*, "terms")=Classes 'terms', 'formula' language percent ~ pce
.. .. .. ..- attr(*, "variables")= language list(percent, pce)
.. .. .. ..- attr(*, "factors")= int [1:2, 1] 0 1
.. .. .. .. ..- attr(*, "dimnames")=List of 2
.. .. .. .. .. ..$ : chr [1:2] "percent" "pce"
.. .. .. .. .. ..$ : chr "pce"
.. .. .. ..- attr(*, "term.labels")= chr "pce"
.. .. .. ..- attr(*, "order")= int 1
.. .. .. ..- attr(*, "intercept")= int 1
.. .. .. ..- attr(*, "response")= int 1
.. .. .. ..- attr(*, ".Environment")=<environment: 0x000002347e74a7e0>
.. .. .. ..- attr(*, "predvars")= language list(percent, pce)
.. .. .. ..- attr(*, "dataClasses")= Named chr [1:2] "numeric" "numeric"
.. .. .. .. ..- attr(*, "names")= chr [1:2] "percent" "pce"
..- attr(*, "class")= chr "lm"
$ 2015:List of 12
..$ coefficients : Named num [1:2] 1.18e-01 -7.48e-06
.. ..- attr(*, "names")= chr [1:2] "(Intercept)" "pce"
..$ residuals : Named num [1:4] 0.0003 -0.000356 -0.000132 0.000188
.. ..- attr(*, "names")= chr [1:4] "1" "2" "3" "4"
..$ effects : Named num [1:4] -0.053947 -0.000879 -0.000452 -0.000256
.. ..- attr(*, "names")= chr [1:4] "(Intercept)" "pce" "" ""
..$ rank : int 2
..$ fitted.values: Named num [1:4] 0.0275 0.0273 0.0267 0.0264
.. ..- attr(*, "names")= chr [1:4] "1" "2" "3" "4"
..$ assign : int [1:2] 0 1
..$ qr :List of 5
.. ..$ qr : num [1:4, 1:2] -2 0.5 0.5 0.5 -24240.2 ...
.. .. ..- attr(*, "dimnames")=List of 2
.. .. .. ..$ : chr [1:4] "1" "2" "3" "4"
.. .. .. ..$ : chr [1:2] "(Intercept)" "pce"
.. .. ..- attr(*, "assign")= int [1:2] 0 1
.. ..$ qraux: num [1:2] 1.5 1.11
.. ..$ pivot: int [1:2] 1 2
.. ..$ tol : num 1e-07
.. ..$ rank : int 2
.. ..- attr(*, "class")= chr "qr"
..$ df.residual : int 2
..$ xlevels : Named list()
..$ call : language lm(formula = percent ~ pce, data = .x)
..$ terms :Classes 'terms', 'formula' language percent ~ pce
.. .. ..- attr(*, "variables")= language list(percent, pce)
.. .. ..- attr(*, "factors")= int [1:2, 1] 0 1
.. .. .. ..- attr(*, "dimnames")=List of 2
.. .. .. .. ..$ : chr [1:2] "percent" "pce"
.. .. .. .. ..$ : chr "pce"
.. .. ..- attr(*, "term.labels")= chr "pce"
.. .. ..- attr(*, "order")= int 1
.. .. ..- attr(*, "intercept")= int 1
.. .. ..- attr(*, "response")= int 1
.. .. ..- attr(*, ".Environment")=<environment: 0x000002347e82e7e8>
.. .. ..- attr(*, "predvars")= language list(percent, pce)
.. .. ..- attr(*, "dataClasses")= Named chr [1:2] "numeric" "numeric"
.. .. .. ..- attr(*, "names")= chr [1:2] "percent" "pce"
..$ model :'data.frame': 4 obs. of 2 variables:
.. ..$ percent: num [1:4] 0.0278 0.0269 0.0266 0.0266
.. ..$ pce : num [1:4] 12046 12082 12158 12194
.. ..- attr(*, "terms")=Classes 'terms', 'formula' language percent ~ pce
.. .. .. ..- attr(*, "variables")= language list(percent, pce)
.. .. .. ..- attr(*, "factors")= int [1:2, 1] 0 1
.. .. .. .. ..- attr(*, "dimnames")=List of 2
.. .. .. .. .. ..$ : chr [1:2] "percent" "pce"
.. .. .. .. .. ..$ : chr "pce"
.. .. .. ..- attr(*, "term.labels")= chr "pce"
.. .. .. ..- attr(*, "order")= int 1
.. .. .. ..- attr(*, "intercept")= int 1
.. .. .. ..- attr(*, "response")= int 1
.. .. .. ..- attr(*, ".Environment")=<environment: 0x000002347e82e7e8>
.. .. .. ..- attr(*, "predvars")= language list(percent, pce)
.. .. .. ..- attr(*, "dataClasses")= Named chr [1:2] "numeric" "numeric"
.. .. .. .. ..- attr(*, "names")= chr [1:2] "percent" "pce"
..- attr(*, "class")= chr "lm"Extract coefficients
You try first
Hint: use coef(). For example, try coef(mods[[1]])
Solution
. . .
coefs <- map(mods, coef)
coefs[c(1:2, length(coefs))]
$`1967`
(Intercept) pce
8.397192e-03 1.307101e-05
$`1968`
(Intercept) pce
2.784626e-02 -2.496983e-05
$`2015`
(Intercept) pce
1.176573e-01 -7.482080e-06 Extract slopes
AKA - the coefficient that is not the intercept
You try first
Extract slopes
. . .
slopes <- map_dbl(coefs, 2)
slopes
1967 1968 1969 1970 1971
1.307101e-05 -2.496983e-05 3.201794e-05 2.136662e-04 1.177357e-05
1972 1973 1974 1975 1976
-2.708060e-05 -6.047148e-06 8.050869e-05 -1.643992e-06 9.413733e-06
1977 1978 1979 1980 1981
-3.366894e-05 -1.151756e-05 5.011539e-06 2.350410e-05 3.150845e-05
1982 1983 1984 1985 1986
6.516215e-05 -4.402208e-05 -1.718497e-05 -6.926535e-06 -6.782516e-06
1987 1988 1989 1990 1991
-1.980421e-05 -7.174276e-06 4.436762e-06 2.611286e-05 1.842612e-05
1992 1993 1994 1995 1996
6.091330e-07 -1.371548e-05 -2.102375e-05 7.718004e-07 -5.567328e-06
1997 1998 1999 2000 2001
-9.936855e-06 -2.283149e-06 -2.893646e-06 -1.601844e-06 3.001365e-05
2002 2003 2004 2005 2006
2.014789e-06 -1.306818e-06 -3.640025e-06 -3.679151e-06 -3.368536e-06
2007 2008 2009 2010 2011
4.187576e-06 -1.494605e-05 2.230078e-05 -5.844266e-06 -5.647401e-06
2012 2013 2014 2015
-1.070319e-05 -1.536441e-05 -8.590683e-06 -7.482080e-06 Plot
relation <- tibble(year = names(slopes),
slope = slopes)
ggplot(relation, aes(slope)) +
geom_histogram(fill = "dodgerblue", color = "white")
Piping
Piping
We could also have done the previous in a pipeline
$`1967`
# A tibble: 6 × 8
date pce pop psavert uempmed unemploy year percent
<date> <dbl> <dbl> <dbl> <dbl> <dbl> <dbl> <dbl>
1 1967-07-01 507. 198712 12.6 4.5 2944 1967 0.0148
2 1967-08-01 510. 198911 12.6 4.7 2945 1967 0.0148
3 1967-09-01 516. 199113 11.9 4.6 2958 1967 0.0149
4 1967-10-01 512. 199311 12.9 4.9 3143 1967 0.0158
5 1967-11-01 517. 199498 12.8 4.7 3066 1967 0.0154
6 1967-12-01 525. 199657 11.8 4.8 3018 1967 0.0151
$`1968`
# A tibble: 12 × 8
date pce pop psavert uempmed unemploy year percent
<date> <dbl> <dbl> <dbl> <dbl> <dbl> <dbl> <dbl>
1 1968-01-01 531. 199808 11.7 5.1 2878 1968 0.0144
2 1968-02-01 534. 199920 12.3 4.5 3001 1968 0.0150
3 1968-03-01 544. 200056 11.7 4.1 2877 1968 0.0144
4 1968-04-01 544 200208 12.3 4.6 2709 1968 0.0135
5 1968-05-01 550. 200361 12 4.4 2740 1968 0.0137
6 1968-06-01 556. 200536 11.7 4.4 2938 1968 0.0147
7 1968-07-01 563. 200706 10.7 4.5 2883 1968 0.0144
8 1968-08-01 567 200898 10.5 4.2 2768 1968 0.0138
9 1968-09-01 568. 201095 10.6 4.6 2686 1968 0.0134
10 1968-10-01 572. 201290 10.8 4.8 2689 1968 0.0134
11 1968-11-01 577. 201466 10.6 4.4 2715 1968 0.0135
12 1968-12-01 576. 201621 11.1 4.4 2685 1968 0.0133
$`1969`
# A tibble: 12 × 8
date pce pop psavert uempmed unemploy year percent
<date> <dbl> <dbl> <dbl> <dbl> <dbl> <dbl> <dbl>
1 1969-01-01 584. 201760 10.3 4.4 2718 1969 0.0135
2 1969-02-01 589. 201881 9.7 4.9 2692 1969 0.0133
3 1969-03-01 589. 202023 10.2 4 2712 1969 0.0134
4 1969-04-01 594. 202161 9.7 4 2758 1969 0.0136
5 1969-05-01 600. 202331 10.1 4.2 2713 1969 0.0134
6 1969-06-01 601. 202507 11.1 4.4 2816 1969 0.0139
7 1969-07-01 603. 202677 11.8 4.4 2868 1969 0.0142
8 1969-08-01 610. 202877 11.5 4.4 2856 1969 0.0141
9 1969-09-01 613. 203090 11.6 4.7 3040 1969 0.0150
10 1969-10-01 618. 203302 11.4 4.5 3049 1969 0.0150
11 1969-11-01 620. 203500 11.6 4.8 2856 1969 0.0140
12 1969-12-01 623. 203675 11.8 4.6 2884 1969 0.0142
$`1970`
# A tibble: 12 × 8
date pce pop psavert uempmed unemploy year percent
<date> <dbl> <dbl> <dbl> <dbl> <dbl> <dbl> <dbl>
1 1970-01-01 629. 203849 11.8 4.6 3201 1970 0.0157
2 1970-02-01 634 204008 11.7 4.5 3453 1970 0.0169
3 1970-03-01 632. 204156 12.4 4.6 3635 1970 0.0178
4 1970-04-01 636 204401 13.3 4.1 3797 1970 0.0186
5 1970-05-01 642. 204607 12.4 4.7 3919 1970 0.0192
6 1970-06-01 646. 204830 12.3 4.9 4071 1970 0.0199
7 1970-07-01 648. 205052 13.5 5.1 4175 1970 0.0204
8 1970-08-01 653. 205295 13.4 5.4 4256 1970 0.0207
9 1970-09-01 659. 205540 12.9 5.2 4456 1970 0.0217
10 1970-10-01 658. 205788 13.1 5.2 4591 1970 0.0223
11 1970-11-01 657. 206024 13.6 5.6 4898 1970 0.0238
12 1970-12-01 666. 206238 13.2 5.9 5076 1970 0.0246
$`1971`
# A tibble: 12 × 8
date pce pop psavert uempmed unemploy year percent
<date> <dbl> <dbl> <dbl> <dbl> <dbl> <dbl> <dbl>
1 1971-01-01 676. 206466 13.3 6.2 4986 1971 0.0241
2 1971-02-01 679. 206668 13.3 6.3 4903 1971 0.0237
3 1971-03-01 682 206855 13.5 6.4 4987 1971 0.0241
4 1971-04-01 689. 207065 13.2 6.5 4959 1971 0.0239
5 1971-05-01 691. 207260 13.6 6.7 4996 1971 0.0241
6 1971-06-01 700. 207462 14.7 5.7 4949 1971 0.0239
7 1971-07-01 699. 207661 13.8 6.2 5035 1971 0.0242
8 1971-08-01 705. 207881 13.6 6.4 5134 1971 0.0247
9 1971-09-01 713 208114 13.3 5.8 5042 1971 0.0242
10 1971-10-01 716. 208345 13.3 6.5 4954 1971 0.0238
11 1971-11-01 721. 208555 13.1 6.4 5161 1971 0.0247
12 1971-12-01 728. 208740 13 6.2 5154 1971 0.0247
$`1972`
# A tibble: 12 × 8
date pce pop psavert uempmed unemploy year percent
<date> <dbl> <dbl> <dbl> <dbl> <dbl> <dbl> <dbl>
1 1972-01-01 732. 208917 12.5 6.2 5019 1972 0.0240
2 1972-02-01 736. 209061 12.8 6.6 4928 1972 0.0236
3 1972-03-01 749. 209212 11.8 6.6 5038 1972 0.0241
4 1972-04-01 752. 209386 11.5 6.7 4959 1972 0.0237
5 1972-05-01 758 209545 11.7 6.6 4922 1972 0.0235
6 1972-06-01 762. 209725 11.7 5.4 4923 1972 0.0235
7 1972-07-01 770. 209896 11.7 6.1 4913 1972 0.0234
8 1972-08-01 776. 210075 12 6 4939 1972 0.0235
9 1972-09-01 781. 210278 12.2 5.6 4849 1972 0.0231
10 1972-10-01 795. 210479 13 5.7 4875 1972 0.0232
11 1972-11-01 800. 210656 13.6 5.7 4602 1972 0.0218
12 1972-12-01 806. 210821 13.7 6.1 4543 1972 0.0215
$`1973`
# A tibble: 12 × 8
date pce pop psavert uempmed unemploy year percent
<date> <dbl> <dbl> <dbl> <dbl> <dbl> <dbl> <dbl>
1 1973-01-01 816. 210985 12.4 5.7 4326 1973 0.0205
2 1973-02-01 826. 211120 12.5 5.2 4452 1973 0.0211
3 1973-03-01 833. 211254 12.7 5.5 4394 1973 0.0208
4 1973-04-01 836. 211420 13.2 5 4459 1973 0.0211
5 1973-05-01 842. 211577 13.2 4.9 4329 1973 0.0205
6 1973-06-01 844. 211746 13.6 5 4363 1973 0.0206
7 1973-07-01 854. 211909 13.2 5.2 4305 1973 0.0203
8 1973-08-01 853. 212092 13.9 4.9 4305 1973 0.0203
9 1973-09-01 869. 212289 13.1 5.4 4350 1973 0.0205
10 1973-10-01 868. 212475 14.4 5.5 4144 1973 0.0195
11 1973-11-01 877. 212634 14.4 5.1 4396 1973 0.0207
12 1973-12-01 877. 212785 14.8 4.7 4489 1973 0.0211
$`1974`
# A tibble: 12 × 8
date pce pop psavert uempmed unemploy year percent
<date> <dbl> <dbl> <dbl> <dbl> <dbl> <dbl> <dbl>
1 1974-01-01 884. 212932 14.3 5 4644 1974 0.0218
2 1974-02-01 890. 213074 14.2 5.1 4731 1974 0.0222
3 1974-03-01 901. 213211 13.4 4.8 4634 1974 0.0217
4 1974-04-01 911. 213361 13.1 5 4618 1974 0.0216
5 1974-05-01 922. 213513 12.8 4.6 4705 1974 0.0220
6 1974-06-01 928 213686 12.8 5.3 4927 1974 0.0231
7 1974-07-01 938. 213854 12.8 5.7 5063 1974 0.0237
8 1974-08-01 955. 214042 12.1 5 5022 1974 0.0235
9 1974-09-01 955. 214246 12.9 5.3 5437 1974 0.0254
10 1974-10-01 959. 214451 13.4 5.5 5523 1974 0.0258
11 1974-11-01 956. 214625 13.8 5.2 6140 1974 0.0286
12 1974-12-01 962. 214782 14 5.7 6636 1974 0.0309
$`1975`
# A tibble: 12 × 8
date pce pop psavert uempmed unemploy year percent
<date> <dbl> <dbl> <dbl> <dbl> <dbl> <dbl> <dbl>
1 1975-01-01 976. 214931 13.2 6.3 7501 1975 0.0349
2 1975-02-01 989. 215065 12.5 7.1 7520 1975 0.0350
3 1975-03-01 991. 215198 12.7 7.2 7978 1975 0.0371
4 1975-04-01 995 215353 14.2 8.7 8210 1975 0.0381
5 1975-05-01 1019. 215523 17.3 9.4 8433 1975 0.0391
6 1975-06-01 1027. 215768 14.3 8.8 8220 1975 0.0381
7 1975-07-01 1040. 215973 12.6 8.6 8127 1975 0.0376
8 1975-08-01 1047 216195 13 9.2 7928 1975 0.0367
9 1975-09-01 1055. 216393 13 9.2 7923 1975 0.0366
10 1975-10-01 1061. 216587 13.4 8.6 7897 1975 0.0365
11 1975-11-01 1076. 216771 12.7 9.5 7794 1975 0.0360
12 1975-12-01 1092. 216931 12 9 7744 1975 0.0357
$`1976`
# A tibble: 12 × 8
date pce pop psavert uempmed unemploy year percent
<date> <dbl> <dbl> <dbl> <dbl> <dbl> <dbl> <dbl>
1 1976-01-01 1107. 217095 11.7 9 7534 1976 0.0347
2 1976-02-01 1108. 217249 12.3 8.2 7326 1976 0.0337
3 1976-03-01 1115. 217381 12.2 8.7 7230 1976 0.0333
4 1976-04-01 1125. 217528 11.7 8.2 7330 1976 0.0337
5 1976-05-01 1123. 217685 12.3 8.3 7053 1976 0.0324
6 1976-06-01 1140. 217861 11.4 7.8 7322 1976 0.0336
7 1976-07-01 1150. 218035 11.7 7.7 7490 1976 0.0344
8 1976-08-01 1158 218233 11.7 7.9 7518 1976 0.0344
9 1976-09-01 1169. 218440 11.4 7.8 7380 1976 0.0338
10 1976-10-01 1177. 218644 11.1 7.7 7430 1976 0.0340
11 1976-11-01 1189 218834 11.4 8.4 7620 1976 0.0348
12 1976-12-01 1212. 219006 10.6 8 7545 1976 0.0345
$`1977`
# A tibble: 12 × 8
date pce pop psavert uempmed unemploy year percent
<date> <dbl> <dbl> <dbl> <dbl> <dbl> <dbl> <dbl>
1 1977-01-01 1215 219179 10.6 7.5 7280 1977 0.0332
2 1977-02-01 1231. 219344 9.3 7.2 7443 1977 0.0339
3 1977-03-01 1238. 219504 10.5 7.2 7307 1977 0.0333
4 1977-04-01 1247. 219684 10.5 7.3 7059 1977 0.0321
5 1977-05-01 1257. 219859 10.3 7.9 6911 1977 0.0314
6 1977-06-01 1264. 220046 10.6 6.2 7134 1977 0.0324
7 1977-07-01 1280. 220239 10.5 7.1 6829 1977 0.0310
8 1977-08-01 1286. 220458 10.9 7 6925 1977 0.0314
9 1977-09-01 1294. 220688 11.1 6.7 6751 1977 0.0306
10 1977-10-01 1311. 220904 11 6.9 6763 1977 0.0306
11 1977-11-01 1327 221109 11.2 7 6815 1977 0.0308
12 1977-12-01 1336 221303 11.4 6.8 6386 1977 0.0289
$`1978`
# A tibble: 12 × 8
date pce pop psavert uempmed unemploy year percent
<date> <dbl> <dbl> <dbl> <dbl> <dbl> <dbl> <dbl>
1 1978-01-01 1330. 221477 11.9 6.5 6489 1978 0.0293
2 1978-02-01 1355. 221629 11.1 6.7 6318 1978 0.0285
3 1978-03-01 1378. 221792 11 6.2 6337 1978 0.0286
4 1978-04-01 1396. 221991 10.8 6.1 6180 1978 0.0278
5 1978-05-01 1412 222176 10.3 5.7 6127 1978 0.0276
6 1978-06-01 1426. 222379 10 6 6028 1978 0.0271
7 1978-07-01 1427. 222585 10.9 5.8 6309 1978 0.0283
8 1978-08-01 1447 222805 10.5 5.8 6080 1978 0.0273
9 1978-09-01 1453. 223053 10.6 5.6 6125 1978 0.0275
10 1978-10-01 1467. 223271 10.7 5.9 5947 1978 0.0266
11 1978-11-01 1481. 223477 10.5 5.5 6077 1978 0.0272
12 1978-12-01 1496. 223670 10.4 5.6 6228 1978 0.0278
$`1979`
# A tibble: 12 × 8
date pce pop psavert uempmed unemploy year percent
<date> <dbl> <dbl> <dbl> <dbl> <dbl> <dbl> <dbl>
1 1979-01-01 1502. 223865 11.1 5.9 6109 1979 0.0273
2 1979-02-01 1518. 224053 11.1 5.9 6173 1979 0.0276
3 1979-03-01 1531. 224235 11.2 5.9 6109 1979 0.0272
4 1979-04-01 1538. 224438 11 5.4 6069 1979 0.0270
5 1979-05-01 1559. 224632 10.3 5.6 5840 1979 0.0260
6 1979-06-01 1576. 224843 9.9 5.6 5959 1979 0.0265
7 1979-07-01 1586. 225055 10.6 5.9 5996 1979 0.0266
8 1979-08-01 1616. 225295 9.7 4.8 6320 1979 0.0281
9 1979-09-01 1634. 225547 9.4 5.5 6190 1979 0.0274
10 1979-10-01 1642. 225801 9.7 5.5 6296 1979 0.0279
11 1979-11-01 1657. 226027 9.7 5.3 6238 1979 0.0276
12 1979-12-01 1666. 226243 10.1 5.7 6325 1979 0.0280
$`1980`
# A tibble: 12 × 8
date pce pop psavert uempmed unemploy year percent
<date> <dbl> <dbl> <dbl> <dbl> <dbl> <dbl> <dbl>
1 1980-01-01 1697. 226451 9.9 5.3 6683 1980 0.0295
2 1980-02-01 1701. 226656 10.1 5.8 6702 1980 0.0296
3 1980-03-01 1708. 226849 10.2 6 6729 1980 0.0297
4 1980-04-01 1695. 227061 11.3 5.8 7358 1980 0.0324
5 1980-05-01 1700. 227251 11.4 5.7 7984 1980 0.0351
6 1980-06-01 1719. 227522 11.2 6.4 8098 1980 0.0356
7 1980-07-01 1747. 227726 11.3 7 8363 1980 0.0367
8 1980-08-01 1764. 227953 11.3 7.5 8281 1980 0.0363
9 1980-09-01 1780. 228186 11.7 7.7 8021 1980 0.0352
10 1980-10-01 1817. 228417 11.3 7.5 8088 1980 0.0354
11 1980-11-01 1827. 228612 11.6 7.7 8023 1980 0.0351
12 1980-12-01 1852. 228779 11.4 7.5 7718 1980 0.0337
$`1981`
# A tibble: 12 × 8
date pce pop psavert uempmed unemploy year percent
<date> <dbl> <dbl> <dbl> <dbl> <dbl> <dbl> <dbl>
1 1981-01-01 1870 228937 10.9 7.4 8071 1981 0.0353
2 1981-02-01 1884. 229071 10.8 7.1 8051 1981 0.0351
3 1981-03-01 1903. 229224 10.8 7.1 7982 1981 0.0348
4 1981-04-01 1904. 229403 10.9 7.4 7869 1981 0.0343
5 1981-05-01 1914. 229575 11 6.9 8174 1981 0.0356
6 1981-06-01 1934. 229761 10.8 6.6 8098 1981 0.0352
7 1981-07-01 1942. 229966 12.3 7.1 7863 1981 0.0342
8 1981-08-01 1967. 230187 12 7.2 8036 1981 0.0349
9 1981-09-01 1966. 230412 12.4 6.8 8230 1981 0.0357
10 1981-10-01 1964. 230641 13 6.8 8646 1981 0.0375
11 1981-11-01 1971. 230822 13.2 6.9 9029 1981 0.0391
12 1981-12-01 1989. 230989 12.5 6.9 9267 1981 0.0401
$`1982`
# A tibble: 12 × 8
date pce pop psavert uempmed unemploy year percent
<date> <dbl> <dbl> <dbl> <dbl> <dbl> <dbl> <dbl>
1 1982-01-01 1997. 231157 12.7 7.1 9397 1982 0.0407
2 1982-02-01 2021. 231313 12.1 7.5 9705 1982 0.0420
3 1982-03-01 2024. 231470 12.2 7.7 9895 1982 0.0427
4 1982-04-01 2026. 231645 12.9 8.1 10244 1982 0.0442
5 1982-05-01 2044. 231809 12.3 8.5 10335 1982 0.0446
6 1982-06-01 2048. 231992 12.3 9.5 10538 1982 0.0454
7 1982-07-01 2072. 232188 12.5 8.5 10849 1982 0.0467
8 1982-08-01 2080. 232392 12.6 8.7 10881 1982 0.0468
9 1982-09-01 2105. 232599 11.8 9.5 11217 1982 0.0482
10 1982-10-01 2126. 232816 11.3 9.7 11529 1982 0.0495
11 1982-11-01 2149. 232993 10.9 10 11938 1982 0.0512
12 1982-12-01 2162. 233160 10.9 10.2 12051 1982 0.0517
$`1983`
# A tibble: 12 × 8
date pce pop psavert uempmed unemploy year percent
<date> <dbl> <dbl> <dbl> <dbl> <dbl> <dbl> <dbl>
1 1983-01-01 2174 233322 11.1 11.1 11534 1983 0.0494
2 1983-02-01 2177 233473 11.1 9.8 11545 1983 0.0494
3 1983-03-01 2203. 233613 10.6 10.4 11408 1983 0.0488
4 1983-04-01 2226. 233781 10.3 10.9 11268 1983 0.0482
5 1983-05-01 2246. 233922 9.9 12.3 11154 1983 0.0477
6 1983-06-01 2276 234118 9.1 11.3 11246 1983 0.0480
7 1983-07-01 2304. 234307 9.6 10.1 10548 1983 0.0450
8 1983-08-01 2320. 234501 9.2 9.3 10623 1983 0.0453
9 1983-09-01 2335. 234701 9.6 9.3 10282 1983 0.0438
10 1983-10-01 2358. 234907 9.7 9.4 9887 1983 0.0421
11 1983-11-01 2366. 235078 10.3 9.3 9499 1983 0.0404
12 1983-12-01 2394. 235235 10.1 8.7 9331 1983 0.0397
$`1984`
# A tibble: 12 × 8
date pce pop psavert uempmed unemploy year percent
<date> <dbl> <dbl> <dbl> <dbl> <dbl> <dbl> <dbl>
1 1984-01-01 2419. 235385 10 9.1 9008 1984 0.0383
2 1984-02-01 2404. 235527 11.7 8.3 8791 1984 0.0373
3 1984-03-01 2432. 235675 11.5 8.3 8746 1984 0.0371
4 1984-04-01 2458. 235839 11.5 8.2 8762 1984 0.0372
5 1984-05-01 2474. 235993 11.1 9.1 8456 1984 0.0358
6 1984-06-01 2496. 236160 11.1 7.5 8226 1984 0.0348
7 1984-07-01 2495. 236348 11.6 7.5 8537 1984 0.0361
8 1984-08-01 2512. 236549 11.8 7.3 8519 1984 0.0360
9 1984-09-01 2534. 236760 11.8 7.6 8367 1984 0.0353
10 1984-10-01 2531. 236976 11.7 7.2 8381 1984 0.0354
11 1984-11-01 2571. 237159 10.9 7.2 8198 1984 0.0346
12 1984-12-01 2583. 237316 11.2 7.3 8358 1984 0.0352
$`1985`
# A tibble: 12 × 8
date pce pop psavert uempmed unemploy year percent
<date> <dbl> <dbl> <dbl> <dbl> <dbl> <dbl> <dbl>
1 1985-01-01 2619. 237468 10.3 6.8 8423 1985 0.0355
2 1985-02-01 2641. 237602 9.1 7.1 8321 1985 0.0350
3 1985-03-01 2648. 237732 8.7 7.1 8339 1985 0.0351
4 1985-04-01 2660. 237900 9.9 6.9 8395 1985 0.0353
5 1985-05-01 2696. 238074 11.1 6.9 8302 1985 0.0349
6 1985-06-01 2689. 238270 9.6 6.6 8460 1985 0.0355
7 1985-07-01 2716. 238466 9.1 6.9 8513 1985 0.0357
8 1985-08-01 2752. 238679 8.2 7.1 8196 1985 0.0343
9 1985-09-01 2795. 238898 7.3 6.9 8248 1985 0.0345
10 1985-10-01 2756. 239113 9.1 7.1 8298 1985 0.0347
11 1985-11-01 2771. 239307 9 7 8128 1985 0.0340
12 1985-12-01 2811. 239477 8.6 6.8 8138 1985 0.0340
$`1986`
# A tibble: 12 × 8
date pce pop psavert uempmed unemploy year percent
<date> <dbl> <dbl> <dbl> <dbl> <dbl> <dbl> <dbl>
1 1986-01-01 2827. 239638 8.6 6.7 7795 1986 0.0325
2 1986-02-01 2820. 239788 9.3 6.9 8402 1986 0.0350
3 1986-03-01 2824. 239928 9.9 6.8 8383 1986 0.0349
4 1986-04-01 2835. 240094 9.7 6.7 8364 1986 0.0348
5 1986-05-01 2858. 240271 9.3 6.8 8439 1986 0.0351
6 1986-06-01 2862. 240459 9.4 7 8508 1986 0.0354
7 1986-07-01 2881. 240651 9.3 6.9 8319 1986 0.0346
8 1986-08-01 2899. 240854 9 7.1 8135 1986 0.0338
9 1986-09-01 2972. 241068 7.2 7.4 8310 1986 0.0345
10 1986-10-01 2933. 241274 8.4 7 8243 1986 0.0342
11 1986-11-01 2928. 241467 8.8 7.1 8159 1986 0.0338
12 1986-12-01 2997. 241620 7 7.1 7883 1986 0.0326
$`1987`
# A tibble: 12 × 8
date pce pop psavert uempmed unemploy year percent
<date> <dbl> <dbl> <dbl> <dbl> <dbl> <dbl> <dbl>
1 1987-01-01 2936. 241784 9.7 6.9 7892 1987 0.0326
2 1987-02-01 3002. 241930 8.5 6.6 7865 1987 0.0325
3 1987-03-01 3013. 242079 8.5 6.6 7862 1987 0.0325
4 1987-04-01 3039. 242252 4.5 7.1 7542 1987 0.0311
5 1987-05-01 3048. 242423 8.2 6.6 7574 1987 0.0312
6 1987-06-01 3073. 242608 7.7 6.5 7398 1987 0.0305
7 1987-07-01 3095. 242804 7.5 6.5 7268 1987 0.0299
8 1987-08-01 3131. 243012 7.2 6.4 7261 1987 0.0299
9 1987-09-01 3126. 243223 7.6 6 7102 1987 0.0292
10 1987-10-01 3134. 243446 8.3 6.3 7227 1987 0.0297
11 1987-11-01 3144. 243639 8.5 6.2 7035 1987 0.0289
12 1987-12-01 3174. 243809 8.7 6 6936 1987 0.0284
$`1988`
# A tibble: 12 × 8
date pce pop psavert uempmed unemploy year percent
<date> <dbl> <dbl> <dbl> <dbl> <dbl> <dbl> <dbl>
1 1988-01-01 3214. 243981 8.1 6.2 6953 1988 0.0285
2 1988-02-01 3221. 244131 8.6 6.3 6929 1988 0.0284
3 1988-03-01 3260. 244279 8.2 6.4 6876 1988 0.0281
4 1988-04-01 3263 244445 8.8 5.9 6601 1988 0.0270
5 1988-05-01 3294. 244610 8.4 5.9 6779 1988 0.0277
6 1988-06-01 3318. 244806 8.4 5.8 6546 1988 0.0267
7 1988-07-01 3343. 245021 8.6 6.1 6605 1988 0.0270
8 1988-08-01 3368 245240 8.4 5.9 6843 1988 0.0279
9 1988-09-01 3375 245464 8.9 5.7 6604 1988 0.0269
10 1988-10-01 3414. 245693 8.6 5.6 6568 1988 0.0267
11 1988-11-01 3430. 245884 8.4 5.7 6537 1988 0.0266
12 1988-12-01 3460. 246056 8.3 5.9 6518 1988 0.0265
$`1989`
# A tibble: 12 × 8
date pce pop psavert uempmed unemploy year percent
<date> <dbl> <dbl> <dbl> <dbl> <dbl> <dbl> <dbl>
1 1989-01-01 3484. 246224 8.5 5.6 6682 1989 0.0271
2 1989-02-01 3488 246378 9 5.4 6359 1989 0.0258
3 1989-03-01 3499. 246530 9.5 5.4 6205 1989 0.0252
4 1989-04-01 3543 246721 8.4 5.4 6468 1989 0.0262
5 1989-05-01 3552. 246906 8.1 5.3 6375 1989 0.0258
6 1989-06-01 3567. 247114 8.2 5.4 6577 1989 0.0266
7 1989-07-01 3586. 247342 8.2 5.6 6495 1989 0.0263
8 1989-08-01 3621. 247573 7.6 5 6511 1989 0.0263
9 1989-09-01 3622. 247816 8.1 4.9 6590 1989 0.0266
10 1989-10-01 3634. 248067 8.5 4.9 6630 1989 0.0267
11 1989-11-01 3643. 248281 8.6 4.8 6725 1989 0.0271
12 1989-12-01 3684. 248479 7.8 4.9 6667 1989 0.0268
$`1990`
# A tibble: 12 × 8
date pce pop psavert uempmed unemploy year percent
<date> <dbl> <dbl> <dbl> <dbl> <dbl> <dbl> <dbl>
1 1990-01-01 3731. 248659 8 5.1 6752 1990 0.0272
2 1990-02-01 3728. 248827 8.6 5.3 6651 1990 0.0267
3 1990-03-01 3755. 249012 8.3 5.1 6598 1990 0.0265
4 1990-04-01 3770 249306 8.8 4.8 6797 1990 0.0273
5 1990-05-01 3776. 249565 8.7 5.2 6742 1990 0.0270
6 1990-06-01 3804. 249849 8.6 5.2 6590 1990 0.0264
7 1990-07-01 3822. 250132 8.7 5.4 6922 1990 0.0277
8 1990-08-01 3848. 250439 8.1 5.4 7188 1990 0.0287
9 1990-09-01 3870. 250751 8.1 5.6 7368 1990 0.0294
10 1990-10-01 3871. 251057 7.8 5.8 7459 1990 0.0297
11 1990-11-01 3872. 251346 7.9 5.7 7764 1990 0.0309
12 1990-12-01 3861. 251626 8.8 5.9 7901 1990 0.0314
$`1991`
# A tibble: 12 × 8
date pce pop psavert uempmed unemploy year percent
<date> <dbl> <dbl> <dbl> <dbl> <dbl> <dbl> <dbl>
1 1991-01-01 3841 251889 9.3 6 8015 1991 0.0318
2 1991-02-01 3867. 252135 8.8 6.2 8265 1991 0.0328
3 1991-03-01 3913 252372 8 6.7 8586 1991 0.0340
4 1991-04-01 3907. 252643 8.6 6.6 8439 1991 0.0334
5 1991-05-01 3933. 252913 8.4 6.4 8736 1991 0.0345
6 1991-06-01 3940. 253207 8.9 6.9 8692 1991 0.0343
7 1991-07-01 3966 253493 8.2 7 8586 1991 0.0339
8 1991-08-01 3969. 253807 8.6 7.3 8666 1991 0.0341
9 1991-09-01 3985. 254126 8.8 6.8 8722 1991 0.0343
10 1991-10-01 3976 254435 9.3 7.2 8842 1991 0.0348
11 1991-11-01 4004. 254718 9 7.5 8931 1991 0.0351
12 1991-12-01 4020. 254964 9.7 7.8 9198 1991 0.0361
$`1992`
# A tibble: 12 × 8
date pce pop psavert uempmed unemploy year percent
<date> <dbl> <dbl> <dbl> <dbl> <dbl> <dbl> <dbl>
1 1992-01-01 4085. 255214 9.4 8.1 9283 1992 0.0364
2 1992-02-01 4100. 255448 9.8 8.2 9454 1992 0.0370
3 1992-03-01 4117 255703 9.7 8.3 9460 1992 0.0370
4 1992-04-01 4132. 255992 9.9 8.5 9415 1992 0.0368
5 1992-05-01 4158. 256285 9.9 8.8 9744 1992 0.0380
6 1992-06-01 4177. 256589 10.1 8.7 10040 1992 0.0391
7 1992-07-01 4205. 256894 9.6 8.6 9850 1992 0.0383
8 1992-08-01 4221. 257232 9.7 8.8 9787 1992 0.0380
9 1992-09-01 4255. 257548 8.7 8.6 9781 1992 0.0380
10 1992-10-01 4285. 257861 8 9 9398 1992 0.0364
11 1992-11-01 4300. 258147 8 9 9565 1992 0.0371
12 1992-12-01 4336. 258413 10.6 9.3 9557 1992 0.0370
$`1993`
# A tibble: 12 × 8
date pce pop psavert uempmed unemploy year percent
<date> <dbl> <dbl> <dbl> <dbl> <dbl> <dbl> <dbl>
1 1993-01-01 4341. 258679 8.6 8.6 9325 1993 0.0360
2 1993-02-01 4355. 258919 8.9 8.5 9183 1993 0.0355
3 1993-03-01 4352. 259152 8.9 8.5 9056 1993 0.0349
4 1993-04-01 4393. 259414 8.7 8.4 9110 1993 0.0351
5 1993-05-01 4422. 259680 8.3 8.1 9149 1993 0.0352
6 1993-06-01 4440 259963 7.8 8.3 9121 1993 0.0351
7 1993-07-01 4469. 260255 7.6 8.2 8930 1993 0.0343
8 1993-08-01 4481. 260566 7.7 8.2 8763 1993 0.0336
9 1993-09-01 4512. 260867 6.9 8.3 8714 1993 0.0334
10 1993-10-01 4533. 261163 6.3 8 8750 1993 0.0335
11 1993-11-01 4554. 261425 6.3 8.3 8542 1993 0.0327
12 1993-12-01 4571. 261674 9.1 8.3 8477 1993 0.0324
$`1994`
# A tibble: 12 × 8
date pce pop psavert uempmed unemploy year percent
<date> <dbl> <dbl> <dbl> <dbl> <dbl> <dbl> <dbl>
1 1994-01-01 4585. 261919 7.1 8.6 8630 1994 0.0329
2 1994-02-01 4633. 262123 6.5 9.2 8583 1994 0.0327
3 1994-03-01 4646 262352 6.8 9.3 8470 1994 0.0323
4 1994-04-01 4671. 262631 6.4 9.1 8331 1994 0.0317
5 1994-05-01 4670. 262877 7.6 9.2 7915 1994 0.0301
6 1994-06-01 4709. 263152 6.9 9.3 7927 1994 0.0301
7 1994-07-01 4721. 263436 7 9 7946 1994 0.0302
8 1994-08-01 4763. 263724 6.5 8.9 7933 1994 0.0301
9 1994-09-01 4775 264017 6.8 9.2 7734 1994 0.0293
10 1994-10-01 4813. 264301 7.1 10 7632 1994 0.0289
11 1994-11-01 4826. 264559 7 9 7375 1994 0.0279
12 1994-12-01 4842. 264804 7.2 8.7 7230 1994 0.0273
$`1995`
# A tibble: 12 × 8
date pce pop psavert uempmed unemploy year percent
<date> <dbl> <dbl> <dbl> <dbl> <dbl> <dbl> <dbl>
1 1995-01-01 4851. 265044 7.5 8 7375 1995 0.0278
2 1995-02-01 4851. 265270 7.8 8.1 7187 1995 0.0271
3 1995-03-01 4885. 265495 7.5 8.3 7153 1995 0.0269
4 1995-04-01 4890. 265755 6.9 8.3 7645 1995 0.0288
5 1995-05-01 4933. 265998 7.1 9.1 7430 1995 0.0279
6 1995-06-01 4978. 266270 6.7 7.9 7427 1995 0.0279
7 1995-07-01 4970. 266557 7.1 8.5 7527 1995 0.0282
8 1995-08-01 5005. 266843 6.7 8.3 7484 1995 0.0280
9 1995-09-01 5020. 267152 6.8 7.9 7478 1995 0.0280
10 1995-10-01 5014. 267456 7.1 8.2 7328 1995 0.0274
11 1995-11-01 5056. 267715 6.6 8 7426 1995 0.0277
12 1995-12-01 5098. 267943 6.1 8.3 7423 1995 0.0277
$`1996`
# A tibble: 12 × 8
date pce pop psavert uempmed unemploy year percent
<date> <dbl> <dbl> <dbl> <dbl> <dbl> <dbl> <dbl>
1 1996-01-01 5086. 268151 6.7 8.3 7491 1996 0.0279
2 1996-02-01 5133. 268364 6.7 7.8 7313 1996 0.0273
3 1996-03-01 5173. 268595 6.6 8.3 7318 1996 0.0272
4 1996-04-01 5208 268853 5.7 8.6 7415 1996 0.0276
5 1996-05-01 5224. 269108 6.7 8.6 7423 1996 0.0276
6 1996-06-01 5230. 269386 7.1 8.3 7095 1996 0.0263
7 1996-07-01 5252. 269667 6.7 8.3 7337 1996 0.0272
8 1996-08-01 5275 269976 6.6 8.4 6882 1996 0.0255
9 1996-09-01 5297. 270284 6.7 8.5 6979 1996 0.0258
10 1996-10-01 5328. 270581 6.4 8.3 7031 1996 0.0260
11 1996-11-01 5351. 270878 6.4 7.7 7236 1996 0.0267
12 1996-12-01 5379. 271125 6.4 7.8 7253 1996 0.0268
$`1997`
# A tibble: 12 × 8
date pce pop psavert uempmed unemploy year percent
<date> <dbl> <dbl> <dbl> <dbl> <dbl> <dbl> <dbl>
1 1997-01-01 5411. 271360 6.2 7.8 7158 1997 0.0264
2 1997-02-01 5434 271585 6.2 8.1 7102 1997 0.0262
3 1997-03-01 5454. 271821 6.4 7.9 7000 1997 0.0258
4 1997-04-01 5459. 272083 6.5 8.3 6873 1997 0.0253
5 1997-05-01 5460. 272342 6.8 8 6655 1997 0.0244
6 1997-06-01 5494. 272622 6.6 8 6799 1997 0.0249
7 1997-07-01 5549. 272912 6.1 8.3 6655 1997 0.0244
8 1997-08-01 5587 273237 6 7.8 6608 1997 0.0242
9 1997-09-01 5602. 273553 6.2 8.2 6656 1997 0.0243
10 1997-10-01 5638. 273852 6.2 7.7 6454 1997 0.0236
11 1997-11-01 5661. 274126 6.4 7.6 6308 1997 0.0230
12 1997-12-01 5692. 274372 6.4 7.5 6476 1997 0.0236
$`1998`
# A tibble: 12 × 8
date pce pop psavert uempmed unemploy year percent
<date> <dbl> <dbl> <dbl> <dbl> <dbl> <dbl> <dbl>
1 1998-01-01 5690. 274626 7.4 7.4 6368 1998 0.0232
2 1998-02-01 5724. 274838 7.4 7 6306 1998 0.0229
3 1998-03-01 5750. 275047 7.5 6.8 6422 1998 0.0233
4 1998-04-01 5788. 275304 7.2 6.7 5941 1998 0.0216
5 1998-05-01 5838. 275564 6.9 6 6047 1998 0.0219
6 1998-06-01 5872. 275836 6.8 6.9 6212 1998 0.0225
7 1998-07-01 5890 276115 6.9 6.7 6259 1998 0.0227
8 1998-08-01 5925 276418 6.8 6.8 6179 1998 0.0224
9 1998-09-01 5966. 276714 6.4 6.7 6300 1998 0.0228
10 1998-10-01 5999. 277003 6.2 5.8 6280 1998 0.0227
11 1998-11-01 6015. 277277 6.3 6.6 6100 1998 0.0220
12 1998-12-01 6070. 277526 5.8 6.8 6032 1998 0.0217
$`1999`
# A tibble: 12 × 8
date pce pop psavert uempmed unemploy year percent
<date> <dbl> <dbl> <dbl> <dbl> <dbl> <dbl> <dbl>
1 1999-01-01 6073. 277790 6.4 6.9 5976 1999 0.0215
2 1999-02-01 6102. 277992 6.2 6.8 6111 1999 0.0220
3 1999-03-01 6133. 278198 5.9 6.8 5783 1999 0.0208
4 1999-04-01 6196. 278451 5.2 6.2 6004 1999 0.0216
5 1999-05-01 6226. 278717 4.9 6.5 5796 1999 0.0208
6 1999-06-01 6254 279001 4.8 6.3 5951 1999 0.0213
7 1999-07-01 6282. 279295 4.8 5.8 6025 1999 0.0216
8 1999-08-01 6326. 279602 4.7 6.5 5838 1999 0.0209
9 1999-09-01 6379. 279903 4.2 6 5915 1999 0.0211
10 1999-10-01 6402. 280203 4.6 6.1 5778 1999 0.0206
11 1999-11-01 6438. 280471 4.8 6.2 5716 1999 0.0204
12 1999-12-01 6539. 280716 4.4 5.8 5653 1999 0.0201
$`2000`
# A tibble: 12 × 8
date pce pop psavert uempmed unemploy year percent
<date> <dbl> <dbl> <dbl> <dbl> <dbl> <dbl> <dbl>
1 2000-01-01 6535. 280976 5.4 5.8 5708 2000 0.0203
2 2000-02-01 6620. 281190 4.8 6.1 5858 2000 0.0208
3 2000-03-01 6686. 281409 4.5 6 5733 2000 0.0204
4 2000-04-01 6671. 281653 5 6.1 5481 2000 0.0195
5 2000-05-01 6708. 281877 4.9 5.8 5758 2000 0.0204
6 2000-06-01 6744. 282126 4.9 5.7 5651 2000 0.0200
7 2000-07-01 6764. 282385 5.2 6 5747 2000 0.0204
8 2000-08-01 6799. 282653 5.2 6.3 5853 2000 0.0207
9 2000-09-01 6883. 282932 4.5 5.2 5625 2000 0.0199
10 2000-10-01 6888. 283201 4.6 6.1 5534 2000 0.0195
11 2000-11-01 6902. 283453 4.5 6.1 5639 2000 0.0199
12 2000-12-01 6946. 283696 4.2 6 5634 2000 0.0199
$`2001`
# A tibble: 12 × 8
date pce pop psavert uempmed unemploy year percent
<date> <dbl> <dbl> <dbl> <dbl> <dbl> <dbl> <dbl>
1 2001-01-01 6977 283920 4.8 5.8 6023 2001 0.0212
2 2001-02-01 6996. 284137 4.9 6.1 6089 2001 0.0214
3 2001-03-01 6988. 284350 5.3 6.6 6141 2001 0.0216
4 2001-04-01 7001. 284581 5 5.9 6271 2001 0.0220
5 2001-05-01 7047. 284810 4.5 6.3 6226 2001 0.0219
6 2001-06-01 7061. 285062 4.5 6 6484 2001 0.0227
7 2001-07-01 7072. 285309 5.6 6.8 6583 2001 0.0231
8 2001-08-01 7109. 285570 6.8 6.9 7042 2001 0.0247
9 2001-09-01 7013. 285843 7 7.2 7142 2001 0.0250
10 2001-10-01 7208. 286098 3.4 7.3 7694 2001 0.0269
11 2001-11-01 7168. 286341 4.1 7.7 8003 2001 0.0279
12 2001-12-01 7148. 286570 4.5 8.2 8258 2001 0.0288
$`2002`
# A tibble: 12 × 8
date pce pop psavert uempmed unemploy year percent
<date> <dbl> <dbl> <dbl> <dbl> <dbl> <dbl> <dbl>
1 2002-01-01 7174. 286788 6.1 8.4 8182 2002 0.0285
2 2002-02-01 7218. 286994 5.8 8.3 8215 2002 0.0286
3 2002-03-01 7237. 287190 5.9 8.4 8304 2002 0.0289
4 2002-04-01 7305. 287397 5.8 8.9 8599 2002 0.0299
5 2002-05-01 7283. 287623 6.5 9.5 8399 2002 0.0292
6 2002-06-01 7318. 287864 6.4 11 8393 2002 0.0292
7 2002-07-01 7380. 288105 5.5 8.9 8390 2002 0.0291
8 2002-08-01 7402. 288360 5.4 9 8304 2002 0.0288
9 2002-09-01 7391 288618 5.7 9.5 8251 2002 0.0286
10 2002-10-01 7431. 288870 5.7 9.6 8307 2002 0.0288
11 2002-11-01 7460. 289106 5.7 9.3 8520 2002 0.0295
12 2002-12-01 7513. 289313 5.5 9.6 8640 2002 0.0299
$`2003`
# A tibble: 12 × 8
date pce pop psavert uempmed unemploy year percent
<date> <dbl> <dbl> <dbl> <dbl> <dbl> <dbl> <dbl>
1 2003-01-01 7533. 289518 5.5 9.6 8520 2003 0.0294
2 2003-02-01 7536. 289714 5.6 9.5 8618 2003 0.0297
3 2003-03-01 7598. 289911 5.3 9.7 8588 2003 0.0296
4 2003-04-01 7621 290125 5.3 10.2 8842 2003 0.0305
5 2003-05-01 7628. 290346 5.8 9.9 8957 2003 0.0308
6 2003-06-01 7679. 290584 5.6 11.5 9266 2003 0.0319
7 2003-07-01 7738. 290820 6.3 10.3 9011 2003 0.0310
8 2003-08-01 7834. 291072 6 10.1 8896 2003 0.0306
9 2003-09-01 7835 291321 5.2 10.2 8921 2003 0.0306
10 2003-10-01 7846. 291574 5.3 10.4 8732 2003 0.0299
11 2003-11-01 7900. 291807 5.4 10.3 8576 2003 0.0294
12 2003-12-01 7929. 292008 5.4 10.4 8317 2003 0.0285
$`2004`
# A tibble: 12 × 8
date pce pop psavert uempmed unemploy year percent
<date> <dbl> <dbl> <dbl> <dbl> <dbl> <dbl> <dbl>
1 2004-01-01 7987. 292192 5 10.6 8370 2004 0.0286
2 2004-02-01 8020. 292368 5 10.2 8167 2004 0.0279
3 2004-03-01 8076 292561 4.9 10.2 8491 2004 0.0290
4 2004-04-01 8089. 292779 5.3 9.5 8170 2004 0.0279
5 2004-05-01 8163. 292997 5.3 9.9 8212 2004 0.0280
6 2004-06-01 8147. 293223 5.8 11 8286 2004 0.0283
7 2004-07-01 8219. 293463 5.3 8.9 8136 2004 0.0277
8 2004-08-01 8253. 293719 5.2 9.2 7990 2004 0.0272
9 2004-09-01 8321. 293971 4.6 9.6 7927 2004 0.0270
10 2004-10-01 8375. 294230 4.5 9.5 8061 2004 0.0274
11 2004-11-01 8421. 294466 4.1 9.7 7932 2004 0.0269
12 2004-12-01 8482. 294694 6.9 9.5 7934 2004 0.0269
$`2005`
# A tibble: 12 × 8
date pce pop psavert uempmed unemploy year percent
<date> <dbl> <dbl> <dbl> <dbl> <dbl> <dbl> <dbl>
1 2005-01-01 8470. 294914 3.7 9.4 7784 2005 0.0264
2 2005-02-01 8529. 295105 3.4 9.2 7980 2005 0.0270
3 2005-03-01 8570. 295287 3.6 9.3 7737 2005 0.0262
4 2005-04-01 8646. 295490 3.1 9 7672 2005 0.0260
5 2005-05-01 8644. 295704 3.5 9.1 7651 2005 0.0259
6 2005-06-01 8725. 295936 2.9 9 7524 2005 0.0254
7 2005-07-01 8830. 296186 2.2 8.8 7406 2005 0.0250
8 2005-08-01 8832. 296440 2.7 9.2 7345 2005 0.0248
9 2005-09-01 8886. 296707 2.7 8.4 7553 2005 0.0255
10 2005-10-01 8927. 296972 3.1 8.6 7453 2005 0.0251
11 2005-11-01 8938. 297207 3.5 8.5 7566 2005 0.0255
12 2005-12-01 8970. 297431 3.7 8.7 7279 2005 0.0245
$`2006`
# A tibble: 12 × 8
date pce pop psavert uempmed unemploy year percent
<date> <dbl> <dbl> <dbl> <dbl> <dbl> <dbl> <dbl>
1 2006-01-01 9060. 297647 4.2 8.6 7064 2006 0.0237
2 2006-02-01 9090. 297854 4.2 9.1 7184 2006 0.0241
3 2006-03-01 9122. 298060 4.2 8.7 7072 2006 0.0237
4 2006-04-01 9175. 298281 4 8.4 7120 2006 0.0239
5 2006-05-01 9215. 298496 3.8 8.5 6980 2006 0.0234
6 2006-06-01 9241. 298739 4 7.3 7001 2006 0.0234
7 2006-07-01 9323. 298996 3.4 8 7175 2006 0.0240
8 2006-08-01 9322. 299263 3.6 8.4 7091 2006 0.0237
9 2006-09-01 9355. 299554 3.6 8 6847 2006 0.0229
10 2006-10-01 9373. 299835 3.6 7.9 6727 2006 0.0224
11 2006-11-01 9380. 300094 3.9 8.3 6872 2006 0.0229
12 2006-12-01 9469 300340 3.7 7.5 6762 2006 0.0225
$`2007`
# A tibble: 12 × 8
date pce pop psavert uempmed unemploy year percent
<date> <dbl> <dbl> <dbl> <dbl> <dbl> <dbl> <dbl>
1 2007-01-01 9516. 300574 3.7 8.3 7116 2007 0.0237
2 2007-02-01 9547. 300802 4.1 8.5 6927 2007 0.0230
3 2007-03-01 9585. 301021 4.4 9.1 6731 2007 0.0224
4 2007-04-01 9616. 301254 4.2 8.6 6850 2007 0.0227
5 2007-05-01 9651. 301483 4 8.2 6766 2007 0.0224
6 2007-06-01 9667. 301739 3.8 7.7 6979 2007 0.0231
7 2007-07-01 9710. 302004 3.7 8.7 7149 2007 0.0237
8 2007-08-01 9754. 302267 3.4 8.8 7067 2007 0.0234
9 2007-09-01 9798. 302546 3.5 8.7 7170 2007 0.0237
10 2007-10-01 9827 302807 3.4 8.4 7237 2007 0.0239
11 2007-11-01 9898. 303054 3.1 8.6 7240 2007 0.0239
12 2007-12-01 9908. 303287 3.6 8.4 7645 2007 0.0252
$`2008`
# A tibble: 12 × 8
date pce pop psavert uempmed unemploy year percent
<date> <dbl> <dbl> <dbl> <dbl> <dbl> <dbl> <dbl>
1 2008-01-01 9930 303506 3.7 9 7685 2008 0.0253
2 2008-02-01 9913. 303711 4.1 8.7 7497 2008 0.0247
3 2008-03-01 9959. 303907 4 8.7 7822 2008 0.0257
4 2008-04-01 9997. 304117 3.4 9.4 7637 2008 0.0251
5 2008-05-01 10054. 304323 7.8 7.9 8395 2008 0.0276
6 2008-06-01 10108. 304556 5.5 9 8575 2008 0.0282
7 2008-07-01 10105. 304798 4.4 9.7 8937 2008 0.0293
8 2008-08-01 10095. 305045 3.8 9.7 9438 2008 0.0309
9 2008-09-01 10044. 305309 4.7 10.2 9494 2008 0.0311
10 2008-10-01 9960. 305554 5.5 10.4 10074 2008 0.0330
11 2008-11-01 9821. 305786 6.4 9.8 10538 2008 0.0345
12 2008-12-01 9731. 306004 6.4 10.5 11286 2008 0.0369
$`2009`
# A tibble: 12 × 8
date pce pop psavert uempmed unemploy year percent
<date> <dbl> <dbl> <dbl> <dbl> <dbl> <dbl> <dbl>
1 2009-01-01 9784. 306208 6.2 10.7 12058 2009 0.0394
2 2009-02-01 9766 306402 5.5 11.7 12898 2009 0.0421
3 2009-03-01 9718. 306588 5.9 12.3 13426 2009 0.0438
4 2009-04-01 9725. 306787 6.8 13.1 13853 2009 0.0452
5 2009-05-01 9749. 306984 8.2 14.2 14499 2009 0.0472
6 2009-06-01 9807. 307206 6.7 17.2 14707 2009 0.0479
7 2009-07-01 9842. 307439 6 16 14601 2009 0.0475
8 2009-08-01 9961 307685 4.9 16.3 14814 2009 0.0481
9 2009-09-01 9883. 307946 5.9 17.8 15009 2009 0.0487
10 2009-10-01 9932. 308189 5.4 18.9 15352 2009 0.0498
11 2009-11-01 9940. 308418 5.9 19.8 15219 2009 0.0493
12 2009-12-01 9999. 308633 5.9 20.1 15098 2009 0.0489
$`2010`
# A tibble: 12 × 8
date pce pop psavert uempmed unemploy year percent
<date> <dbl> <dbl> <dbl> <dbl> <dbl> <dbl> <dbl>
1 2010-01-01 10002. 308833 6.1 20 15046 2010 0.0487
2 2010-02-01 10031. 309027 5.8 19.9 15113 2010 0.0489
3 2010-03-01 10089. 309212 5.7 20.4 15202 2010 0.0492
4 2010-04-01 10113. 309191. 6.4 22.1 15325 2010 0.0496
5 2010-05-01 10131 309369. 7 22.3 14849 2010 0.0480
6 2010-06-01 10151. 309549. 6.9 25.2 14474 2010 0.0468
7 2010-07-01 10185. 309746. 6.8 22.3 14512 2010 0.0469
8 2010-08-01 10228. 309958. 6.9 21 14648 2010 0.0473
9 2010-09-01 10249 310176. 6.7 20.3 14579 2010 0.0470
10 2010-10-01 10305. 310400. 6.6 21.2 14516 2010 0.0468
11 2010-11-01 10355. 310596. 6.6 21 15081 2010 0.0486
12 2010-12-01 10392. 310782. 7.1 21.9 14348 2010 0.0462
$`2011`
# A tibble: 12 × 8
date pce pop psavert uempmed unemploy year percent
<date> <dbl> <dbl> <dbl> <dbl> <dbl> <dbl> <dbl>
1 2011-01-01 10436. 310961. 7.4 21.5 14013 2011 0.0451
2 2011-02-01 10470. 311113. 7.6 21.1 13820 2011 0.0444
3 2011-03-01 10550. 311265. 7 21.5 13737 2011 0.0441
4 2011-04-01 10588. 311436. 6.9 20.9 13957 2011 0.0448
5 2011-05-01 10612 311607. 6.9 21.6 13855 2011 0.0445
6 2011-06-01 10637. 311791. 7.2 22.4 13962 2011 0.0448
7 2011-07-01 10678. 311997. 7.3 22 13763 2011 0.0441
8 2011-08-01 10701. 312205. 7.2 22.4 13818 2011 0.0443
9 2011-09-01 10738. 312429. 6.8 22 13948 2011 0.0446
10 2011-10-01 10753. 312644. 6.8 20.6 13594 2011 0.0435
11 2011-11-01 10760. 312830. 7 20.8 13302 2011 0.0425
12 2011-12-01 10772. 313010. 7.8 20.5 13093 2011 0.0418
$`2012`
# A tibble: 12 × 8
date pce pop psavert uempmed unemploy year percent
<date> <dbl> <dbl> <dbl> <dbl> <dbl> <dbl> <dbl>
1 2012-01-01 10862. 313183. 8 20.8 12797 2012 0.0409
2 2012-02-01 10954. 313339. 8 19.7 12813 2012 0.0409
3 2012-03-01 10952. 313499. 8.5 19.2 12713 2012 0.0406
4 2012-04-01 10980. 313667. 8.7 19.1 12646 2012 0.0403
5 2012-05-01 10969. 313831. 8.8 19.9 12660 2012 0.0403
6 2012-06-01 10946. 314018. 9.1 20.4 12692 2012 0.0404
7 2012-07-01 10977. 314211. 8.2 17.5 12656 2012 0.0403
8 2012-08-01 11004. 314422. 8 18.4 12471 2012 0.0397
9 2012-09-01 11062. 314647. 8.2 18.8 12115 2012 0.0385
10 2012-10-01 11100. 314854. 8.8 19.9 12124 2012 0.0385
11 2012-11-01 11137. 315054. 9.7 18.6 12005 2012 0.0381
12 2012-12-01 11140. 315233. 12 17.7 12298 2012 0.0390
$`2013`
# A tibble: 12 × 8
date pce pop psavert uempmed unemploy year percent
<date> <dbl> <dbl> <dbl> <dbl> <dbl> <dbl> <dbl>
1 2013-01-01 11203. 315390. 6.3 15.8 12471 2013 0.0395
2 2013-02-01 11240. 315520. 5.8 17.2 11950 2013 0.0379
3 2013-03-01 11227. 315662. 5.9 17.6 11689 2013 0.0370
4 2013-04-01 11205. 315818. 6.4 17.1 11760 2013 0.0372
5 2013-05-01 11245. 315984. 6.7 17.1 11654 2013 0.0369
6 2013-06-01 11269. 316171. 6.8 17 11751 2013 0.0372
7 2013-07-01 11297. 316359. 6.6 16.2 11335 2013 0.0358
8 2013-08-01 11329. 316580. 6.7 16.5 11279 2013 0.0356
9 2013-09-01 11367. 316806. 6.8 16.5 11270 2013 0.0356
10 2013-10-01 11420. 317022. 6.3 16.3 11136 2013 0.0351
11 2013-11-01 11488. 317228. 6.2 17.1 10787 2013 0.0340
12 2013-12-01 11518. 317412. 6.4 17.3 10404 2013 0.0328
$`2014`
# A tibble: 12 × 8
date pce pop psavert uempmed unemploy year percent
<date> <dbl> <dbl> <dbl> <dbl> <dbl> <dbl> <dbl>
1 2014-01-01 11512. 317594. 7.1 15.4 10202 2014 0.0321
2 2014-02-01 11566. 317754. 7.3 15.9 10349 2014 0.0326
3 2014-03-01 11643 317917. 7.4 15.8 10380 2014 0.0327
4 2014-04-01 11703. 318089. 7.4 15.7 9702 2014 0.0305
5 2014-05-01 11748. 318270. 7.4 14.6 9859 2014 0.0310
6 2014-06-01 11817 318464. 7.4 13.8 9460 2014 0.0297
7 2014-07-01 11860. 318662. 7.5 13.1 9608 2014 0.0302
8 2014-08-01 11944. 318894. 7.2 12.9 9599 2014 0.0301
9 2014-09-01 11957. 319125. 7.4 13.4 9262 2014 0.0290
10 2014-10-01 12023 319354. 7.2 13.6 8990 2014 0.0282
11 2014-11-01 12051. 319564. 7.3 13 9090 2014 0.0284
12 2014-12-01 12062 319746. 7.6 12.9 8717 2014 0.0273
$`2015`
# A tibble: 4 × 8
date pce pop psavert uempmed unemploy year percent
<date> <dbl> <dbl> <dbl> <dbl> <dbl> <dbl> <dbl>
1 2015-01-01 12046 319929. 7.7 13.2 8903 2015 0.0278
2 2015-02-01 12082. 320075. 7.9 12.9 8610 2015 0.0269
3 2015-03-01 12158. 320231. 7.4 12 8504 2015 0.0266
4 2015-04-01 12194. 320402. 7.6 11.5 8526 2015 0.0266Piping
We could also have done the previous in a pipeline
$`1967`
Call:
lm(formula = percent ~ pce, data = .x)
Coefficients:
(Intercept) pce
8.397e-03 1.307e-05
$`1968`
Call:
lm(formula = percent ~ pce, data = .x)
Coefficients:
(Intercept) pce
2.785e-02 -2.497e-05
$`1969`
Call:
lm(formula = percent ~ pce, data = .x)
Coefficients:
(Intercept) pce
-5.363e-03 3.202e-05
$`1970`
Call:
lm(formula = percent ~ pce, data = .x)
Coefficients:
(Intercept) pce
-0.1180578 0.0002137
$`1971`
Call:
lm(formula = percent ~ pce, data = .x)
Coefficients:
(Intercept) pce
1.595e-02 1.177e-05
$`1972`
Call:
lm(formula = percent ~ pce, data = .x)
Coefficients:
(Intercept) pce
4.404e-02 -2.708e-05
$`1973`
Call:
lm(formula = percent ~ pce, data = .x)
Coefficients:
(Intercept) pce
2.571e-02 -6.047e-06
$`1974`
Call:
lm(formula = percent ~ pce, data = .x)
Coefficients:
(Intercept) pce
-5.070e-02 8.051e-05
$`1975`
Call:
lm(formula = percent ~ pce, data = .x)
Coefficients:
(Intercept) pce
3.847e-02 -1.644e-06
$`1976`
Call:
lm(formula = percent ~ pce, data = .x)
Coefficients:
(Intercept) pce
2.313e-02 9.414e-06
$`1977`
Call:
lm(formula = percent ~ pce, data = .x)
Coefficients:
(Intercept) pce
7.454e-02 -3.367e-05
$`1978`
Call:
lm(formula = percent ~ pce, data = .x)
Coefficients:
(Intercept) pce
4.419e-02 -1.152e-05
$`1979`
Call:
lm(formula = percent ~ pce, data = .x)
Coefficients:
(Intercept) pce
1.932e-02 5.012e-06
$`1980`
Call:
lm(formula = percent ~ pce, data = .x)
Coefficients:
(Intercept) pce
-0.0074548 0.0000235
$`1981`
Call:
lm(formula = percent ~ pce, data = .x)
Coefficients:
(Intercept) pce
-2.494e-02 3.151e-05
$`1982`
Call:
lm(formula = percent ~ pce, data = .x)
Coefficients:
(Intercept) pce
-8.882e-02 6.516e-05
$`1983`
Call:
lm(formula = percent ~ pce, data = .x)
Coefficients:
(Intercept) pce
1.461e-01 -4.402e-05
$`1984`
Call:
lm(formula = percent ~ pce, data = .x)
Coefficients:
(Intercept) pce
7.893e-02 -1.718e-05
$`1985`
Call:
lm(formula = percent ~ pce, data = .x)
Coefficients:
(Intercept) pce
5.366e-02 -6.927e-06
$`1986`
Call:
lm(formula = percent ~ pce, data = .x)
Coefficients:
(Intercept) pce
5.385e-02 -6.783e-06
$`1987`
Call:
lm(formula = percent ~ pce, data = .x)
Coefficients:
(Intercept) pce
0.0914664 -0.0000198
$`1988`
Call:
lm(formula = percent ~ pce, data = .x)
Coefficients:
(Intercept) pce
5.123e-02 -7.174e-06
$`1989`
Call:
lm(formula = percent ~ pce, data = .x)
Coefficients:
(Intercept) pce
1.051e-02 4.437e-06
$`1990`
Call:
lm(formula = percent ~ pce, data = .x)
Coefficients:
(Intercept) pce
-7.123e-02 2.611e-05
$`1991`
Call:
lm(formula = percent ~ pce, data = .x)
Coefficients:
(Intercept) pce
-3.857e-02 1.843e-05
$`1992`
Call:
lm(formula = percent ~ pce, data = .x)
Coefficients:
(Intercept) pce
3.487e-02 6.091e-07
$`1993`
Call:
lm(formula = percent ~ pce, data = .x)
Coefficients:
(Intercept) pce
9.538e-02 -1.372e-05
$`1994`
Call:
lm(formula = percent ~ pce, data = .x)
Coefficients:
(Intercept) pce
1.295e-01 -2.102e-05
$`1995`
Call:
lm(formula = percent ~ pce, data = .x)
Coefficients:
(Intercept) pce
2.397e-02 7.718e-07
$`1996`
Call:
lm(formula = percent ~ pce, data = .x)
Coefficients:
(Intercept) pce
5.602e-02 -5.567e-06
$`1997`
Call:
lm(formula = percent ~ pce, data = .x)
Coefficients:
(Intercept) pce
7.968e-02 -9.937e-06
$`1998`
Call:
lm(formula = percent ~ pce, data = .x)
Coefficients:
(Intercept) pce
3.590e-02 -2.283e-06
$`1999`
Call:
lm(formula = percent ~ pce, data = .x)
Coefficients:
(Intercept) pce
3.923e-02 -2.894e-06
$`2000`
Call:
lm(formula = percent ~ pce, data = .x)
Coefficients:
(Intercept) pce
3.097e-02 -1.602e-06
$`2001`
Call:
lm(formula = percent ~ pce, data = .x)
Coefficients:
(Intercept) pce
-1.881e-01 3.001e-05
$`2002`
Call:
lm(formula = percent ~ pce, data = .x)
Coefficients:
(Intercept) pce
1.428e-02 2.015e-06
$`2003`
Call:
lm(formula = percent ~ pce, data = .x)
Coefficients:
(Intercept) pce
4.026e-02 -1.307e-06
$`2004`
Call:
lm(formula = percent ~ pce, data = .x)
Coefficients:
(Intercept) pce
5.764e-02 -3.640e-06
$`2005`
Call:
lm(formula = percent ~ pce, data = .x)
Coefficients:
(Intercept) pce
5.778e-02 -3.679e-06
$`2006`
Call:
lm(formula = percent ~ pce, data = .x)
Coefficients:
(Intercept) pce
5.458e-02 -3.369e-06
$`2007`
Call:
lm(formula = percent ~ pce, data = .x)
Coefficients:
(Intercept) pce
-1.722e-02 4.188e-06
$`2008`
Call:
lm(formula = percent ~ pce, data = .x)
Coefficients:
(Intercept) pce
1.785e-01 -1.495e-05
$`2009`
Call:
lm(formula = percent ~ pce, data = .x)
Coefficients:
(Intercept) pce
-1.73e-01 2.23e-05
$`2010`
Call:
lm(formula = percent ~ pce, data = .x)
Coefficients:
(Intercept) pce
1.073e-01 -5.844e-06
$`2011`
Call:
lm(formula = percent ~ pce, data = .x)
Coefficients:
(Intercept) pce
1.041e-01 -5.647e-06
$`2012`
Call:
lm(formula = percent ~ pce, data = .x)
Coefficients:
(Intercept) pce
0.1575956 -0.0000107
$`2013`
Call:
lm(formula = percent ~ pce, data = .x)
Coefficients:
(Intercept) pce
2.101e-01 -1.536e-05
$`2014`
Call:
lm(formula = percent ~ pce, data = .x)
Coefficients:
(Intercept) pce
1.317e-01 -8.591e-06
$`2015`
Call:
lm(formula = percent ~ pce, data = .x)
Coefficients:
(Intercept) pce
1.177e-01 -7.482e-06 Piping
We could also have done the previous in a pipeline
$`1967`
(Intercept) pce
8.397192e-03 1.307101e-05
$`1968`
(Intercept) pce
2.784626e-02 -2.496983e-05
$`1969`
(Intercept) pce
-5.362991e-03 3.201794e-05
$`1970`
(Intercept) pce
-0.1180577869 0.0002136662
$`1971`
(Intercept) pce
1.594909e-02 1.177357e-05
$`1972`
(Intercept) pce
0.0440400392 -0.0000270806
$`1973`
(Intercept) pce
2.571465e-02 -6.047148e-06
$`1974`
(Intercept) pce
-5.069693e-02 8.050869e-05
$`1975`
(Intercept) pce
3.847047e-02 -1.643992e-06
$`1976`
(Intercept) pce
2.313211e-02 9.413733e-06
$`1977`
(Intercept) pce
7.453726e-02 -3.366894e-05
$`1978`
(Intercept) pce
4.418640e-02 -1.151756e-05
$`1979`
(Intercept) pce
1.932149e-02 5.011539e-06
$`1980`
(Intercept) pce
-0.0074548418 0.0000235041
$`1981`
(Intercept) pce
-2.494231e-02 3.150845e-05
$`1982`
(Intercept) pce
-8.881640e-02 6.516215e-05
$`1983`
(Intercept) pce
1.461015e-01 -4.402208e-05
$`1984`
(Intercept) pce
7.892629e-02 -1.718497e-05
$`1985`
(Intercept) pce
5.366118e-02 -6.926535e-06
$`1986`
(Intercept) pce
5.384654e-02 -6.782516e-06
$`1987`
(Intercept) pce
9.146640e-02 -1.980421e-05
$`1988`
(Intercept) pce
5.122852e-02 -7.174276e-06
$`1989`
(Intercept) pce
1.051097e-02 4.436762e-06
$`1990`
(Intercept) pce
-7.123114e-02 2.611286e-05
$`1991`
(Intercept) pce
-3.856927e-02 1.842612e-05
$`1992`
(Intercept) pce
3.487276e-02 6.091330e-07
$`1993`
(Intercept) pce
9.537911e-02 -1.371548e-05
$`1994`
(Intercept) pce
1.295460e-01 -2.102375e-05
$`1995`
(Intercept) pce
2.396737e-02 7.718004e-07
$`1996`
(Intercept) pce
5.602360e-02 -5.567328e-06
$`1997`
(Intercept) pce
7.968484e-02 -9.936855e-06
$`1998`
(Intercept) pce
3.589534e-02 -2.283149e-06
$`1999`
(Intercept) pce
3.922715e-02 -2.893646e-06
$`2000`
(Intercept) pce
3.097125e-02 -1.601844e-06
$`2001`
(Intercept) pce
-1.881272e-01 3.001365e-05
$`2002`
(Intercept) pce
1.428471e-02 2.014789e-06
$`2003`
(Intercept) pce
4.025941e-02 -1.306818e-06
$`2004`
(Intercept) pce
5.763951e-02 -3.640025e-06
$`2005`
(Intercept) pce
5.777898e-02 -3.679151e-06
$`2006`
(Intercept) pce
5.458272e-02 -3.368536e-06
$`2007`
(Intercept) pce
-1.721961e-02 4.187576e-06
$`2008`
(Intercept) pce
1.784624e-01 -1.494605e-05
$`2009`
(Intercept) pce
-1.729902e-01 2.230078e-05
$`2010`
(Intercept) pce
1.073378e-01 -5.844266e-06
$`2011`
(Intercept) pce
1.041383e-01 -5.647401e-06
$`2012`
(Intercept) pce
1.575956e-01 -1.070319e-05
$`2013`
(Intercept) pce
2.101046e-01 -1.536441e-05
$`2014`
(Intercept) pce
1.317146e-01 -8.590683e-06
$`2015`
(Intercept) pce
1.176573e-01 -7.482080e-06 Piping
We could also have done the previous in a pipeline
         1967          1968          1969          1970          1971
 1.307101e-05 -2.496983e-05  3.201794e-05  2.136662e-04  1.177357e-05
         1972          1973          1974          1975          1976
-2.708060e-05 -6.047148e-06  8.050869e-05 -1.643992e-06  9.413733e-06
         1977          1978          1979          1980          1981
-3.366894e-05 -1.151756e-05  5.011539e-06  2.350410e-05  3.150845e-05
         1982          1983          1984          1985          1986
 6.516215e-05 -4.402208e-05 -1.718497e-05 -6.926535e-06 -6.782516e-06
         1987          1988          1989          1990          1991
-1.980421e-05 -7.174276e-06  4.436762e-06  2.611286e-05  1.842612e-05
         1992          1993          1994          1995          1996
 6.091330e-07 -1.371548e-05 -2.102375e-05  7.718004e-07 -5.567328e-06
         1997          1998          1999          2000          2001
-9.936855e-06 -2.283149e-06 -2.893646e-06 -1.601844e-06  3.001365e-05
         2002          2003          2004          2005          2006
 2.014789e-06 -1.306818e-06 -3.640025e-06 -3.679151e-06 -3.368536e-06
         2007          2008          2009          2010          2011
 4.187576e-06 -1.494605e-05  2.230078e-05 -5.844266e-06 -5.647401e-06
         2012          2013          2014          2015
-1.070319e-05 -1.536441e-05 -8.590683e-06 -7.482080e-06 List column
We could also have done the previous in a pipeline and a list column
mods_econ <- econ |>
  group_by(year) |>
  nest() |> # : split(econ, econ$year)
  mutate(data = map(data,
                    ~mutate(.x, percent = unemploy / pop)), # compute 'percent'
         mods = map(data,
                   ~lm(percent ~ pce, data = .x)), # fit the model
         coefs = map(mods, coef), # extract coefficients
         slopes = map_dbl(coefs, 2) # extract slopes
         )
mods_econ
# A tibble: 49 × 5
# Groups: year [49]
year data mods coefs slopes
<dbl> <list> <list> <list> <dbl>
1 1967 <tibble [6 × 7]> <lm> <dbl [2]> 0.0000131
2 1968 <tibble [12 × 7]> <lm> <dbl [2]> -0.0000250
3 1969 <tibble [12 × 7]> <lm> <dbl [2]> 0.0000320
4 1970 <tibble [12 × 7]> <lm> <dbl [2]> 0.000214
5 1971 <tibble [12 × 7]> <lm> <dbl [2]> 0.0000118
6 1972 <tibble [12 × 7]> <lm> <dbl [2]> -0.0000271
7 1973 <tibble [12 × 7]> <lm> <dbl [2]> -0.00000605
8 1974 <tibble [12 × 7]> <lm> <dbl [2]> 0.0000805
9 1975 <tibble [12 × 7]> <lm> <dbl [2]> -0.00000164
10 1976 <tibble [12 × 7]> <lm> <dbl [2]> 0.00000941
# ℹ 39 more rowsWhat do our friends think about this…
What do our friends think about this…

Let’s plot it
mods_econ |>
  ggplot(aes(slopes)) +
    geom_histogram(fill = "dodgerblue", color = "white")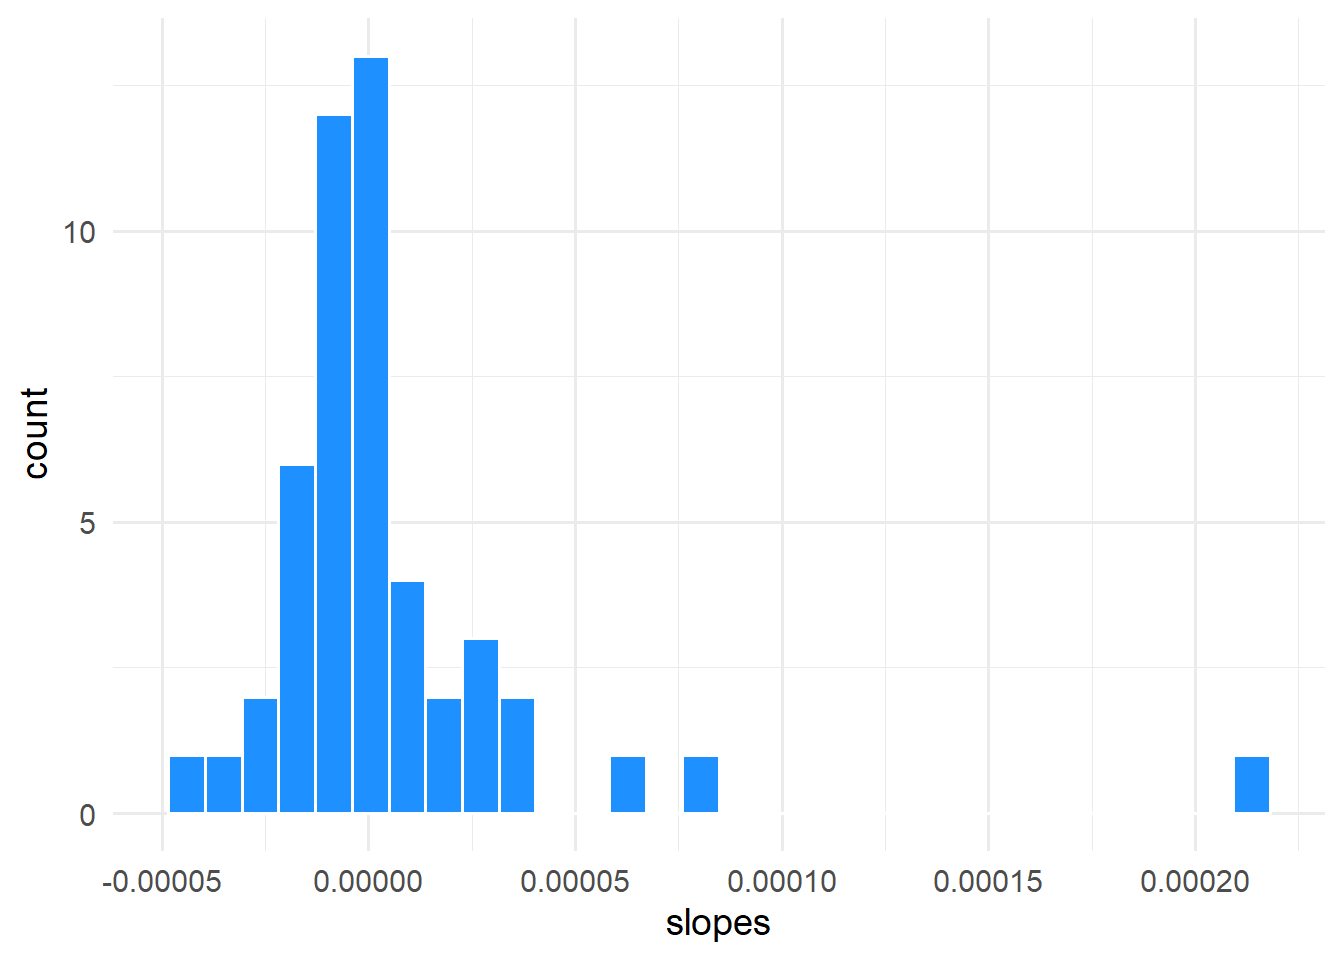
More Practice
If we have time before the lab
Practice
- Compute the standard deviation of every
mtcarscolumn - Copy and run the following code to obtain 50 bootstrap samples
- Fit the following model to each bootstrap sample:
mpg ~ disp
- Extract \(R^2\) and plot the distribution
bootstrap <- function(df) {
  df[sample(nrow(df), replace = TRUE), , drop = FALSE]
}
Next time
Before next class
- Readings
- Lab 2
- Clone course repo